All the data of your place,
in one place

Trusted by teams at

Your community is changing,
and so do we.

Community Compass is powered by dynamic data, so it changes as your community does.

Community Compass

Delve deeper into the data of your community

Understand how your community is performing and the reasons behind these trends.

Community compass

See all dynamic data in a single dashboard

A rich blend of data points is used to build a comprehensive view of your community.

Community compass access
Access

Uncover a wealth of insights with the Access pillar, providing a detailed analysis of the accessibility of essential community facilities and utilities. Easily identify areas requiring additional support, ensuring equitable access to vital resources.

Community Compass Crime
Crime

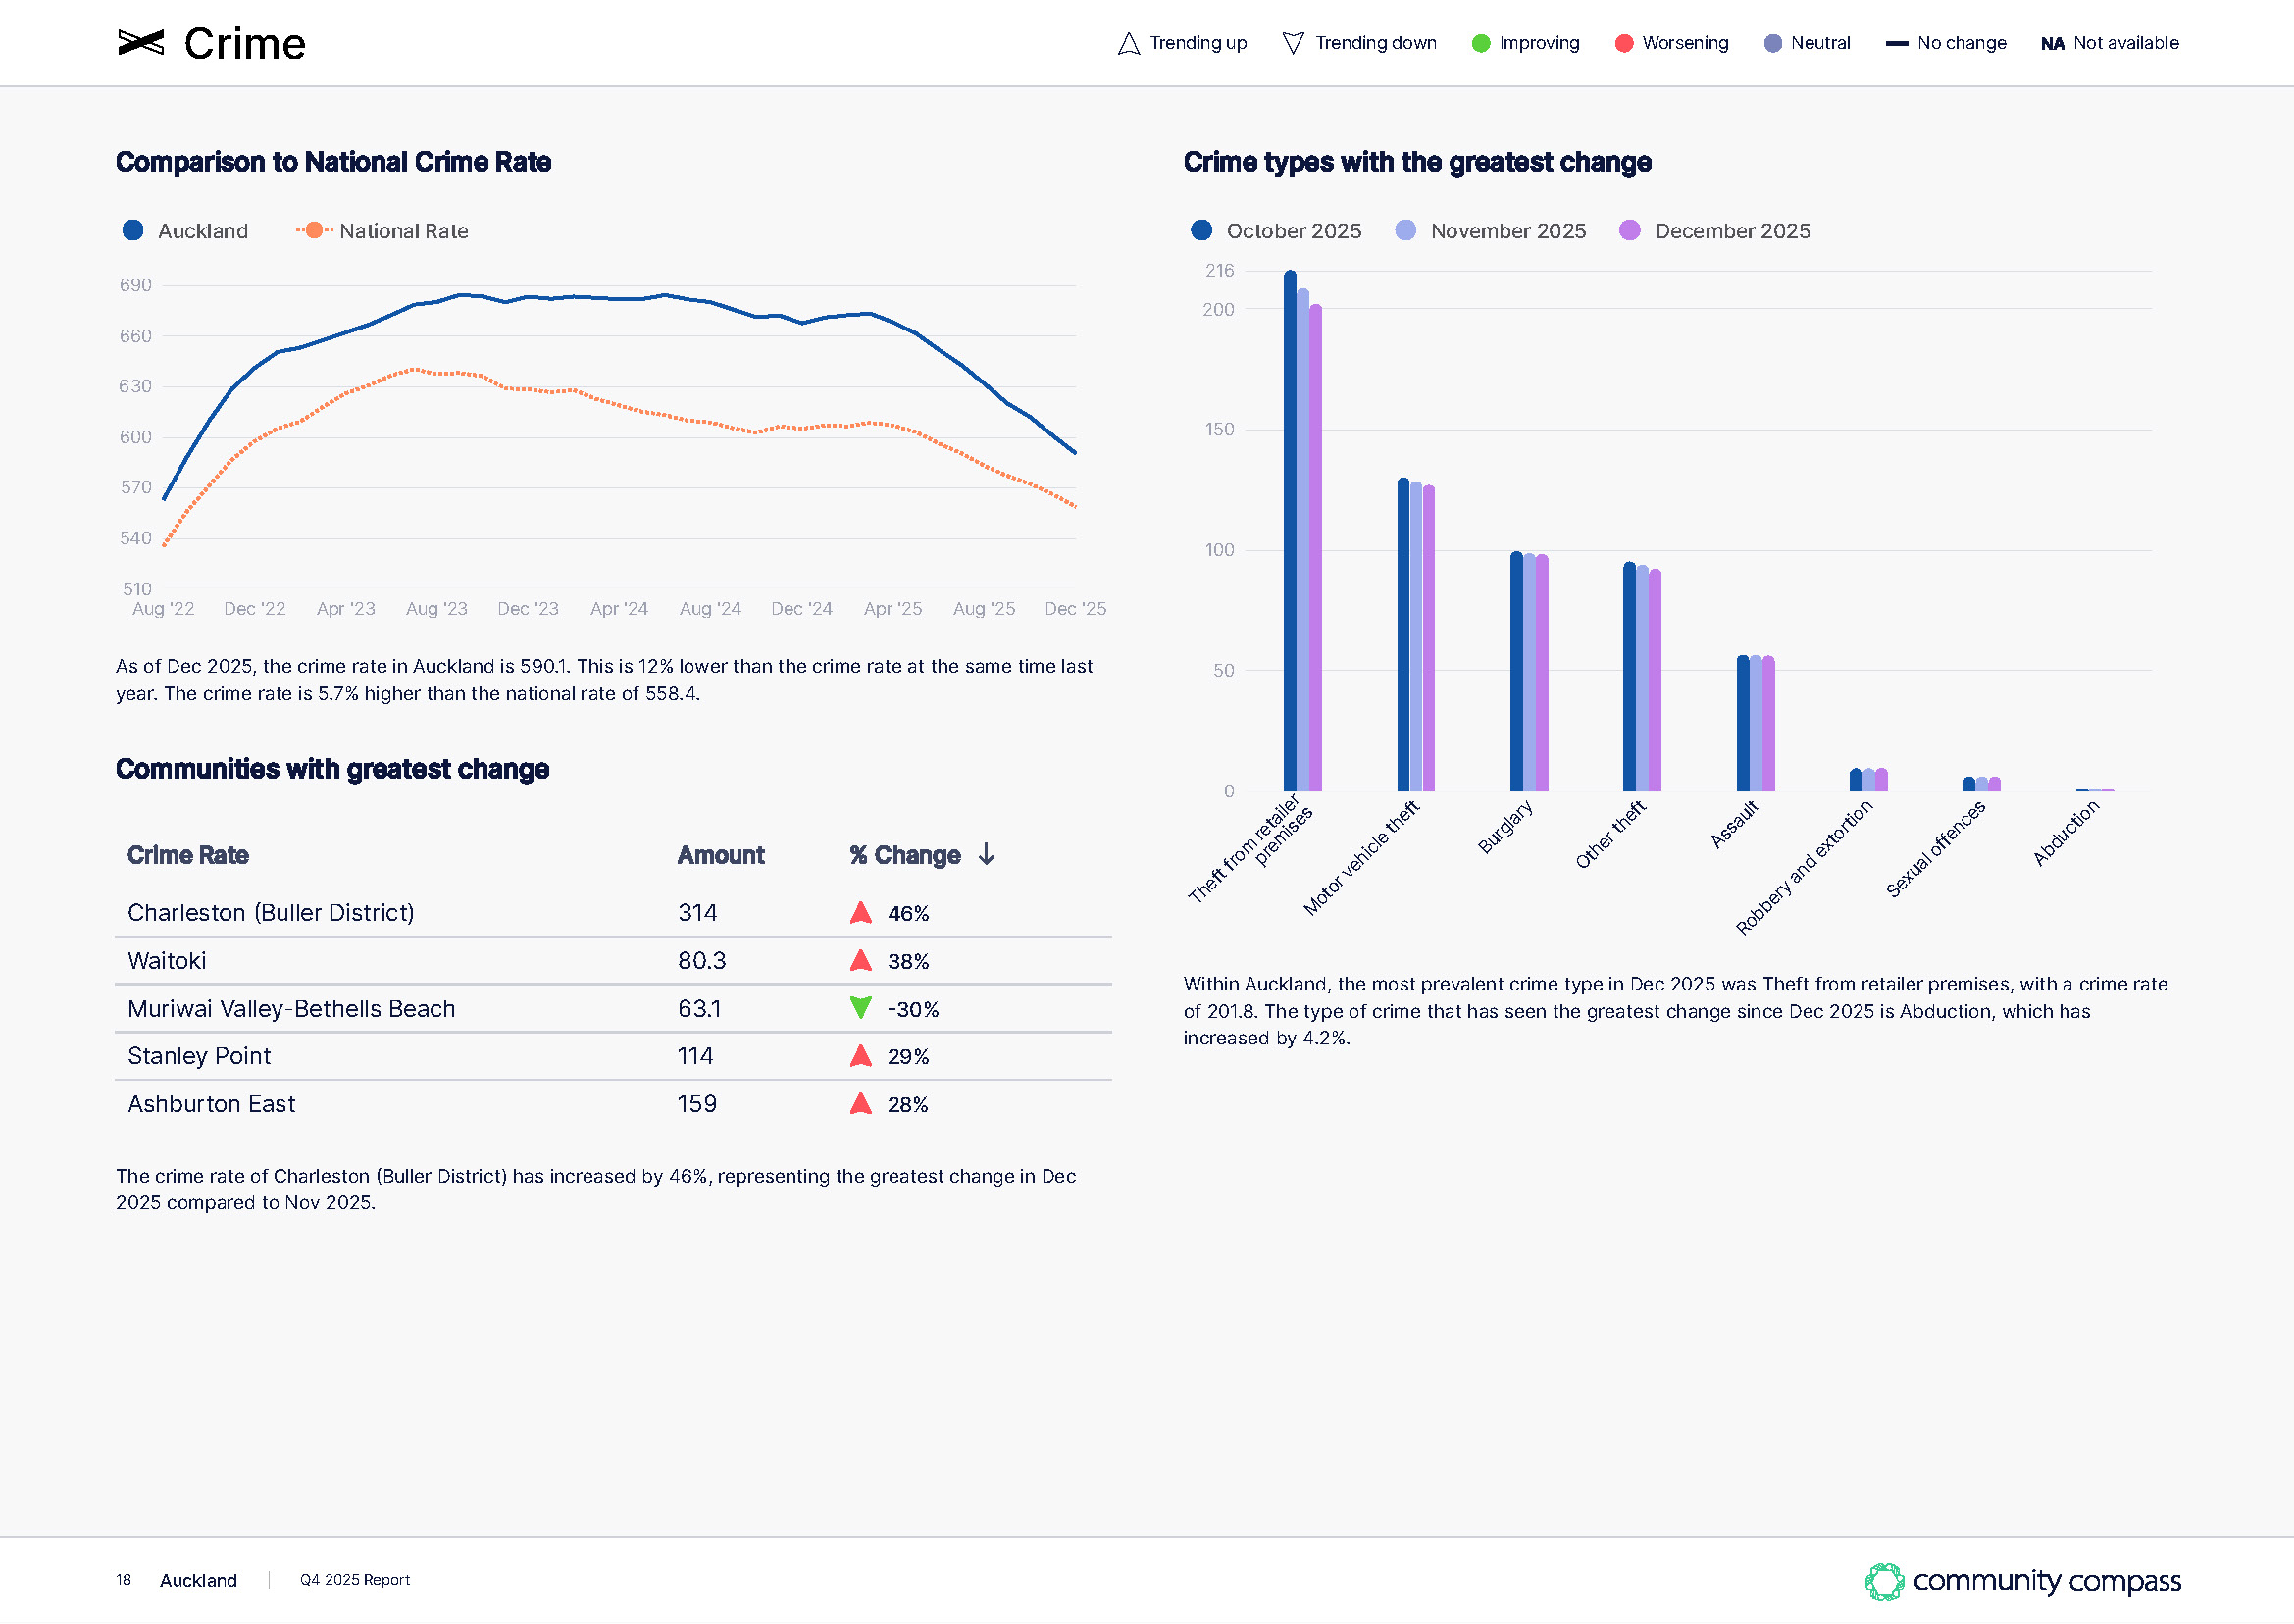
Empower yourself with the Crime pillar, offering invaluable insights into crime rates within your communities. Effectively monitor areas that need additional measures, proactively address concerns, and enhance safety. Evaluate the impact of your initiatives for a safer and more secure community.

Community Compass Demographics
Demographics

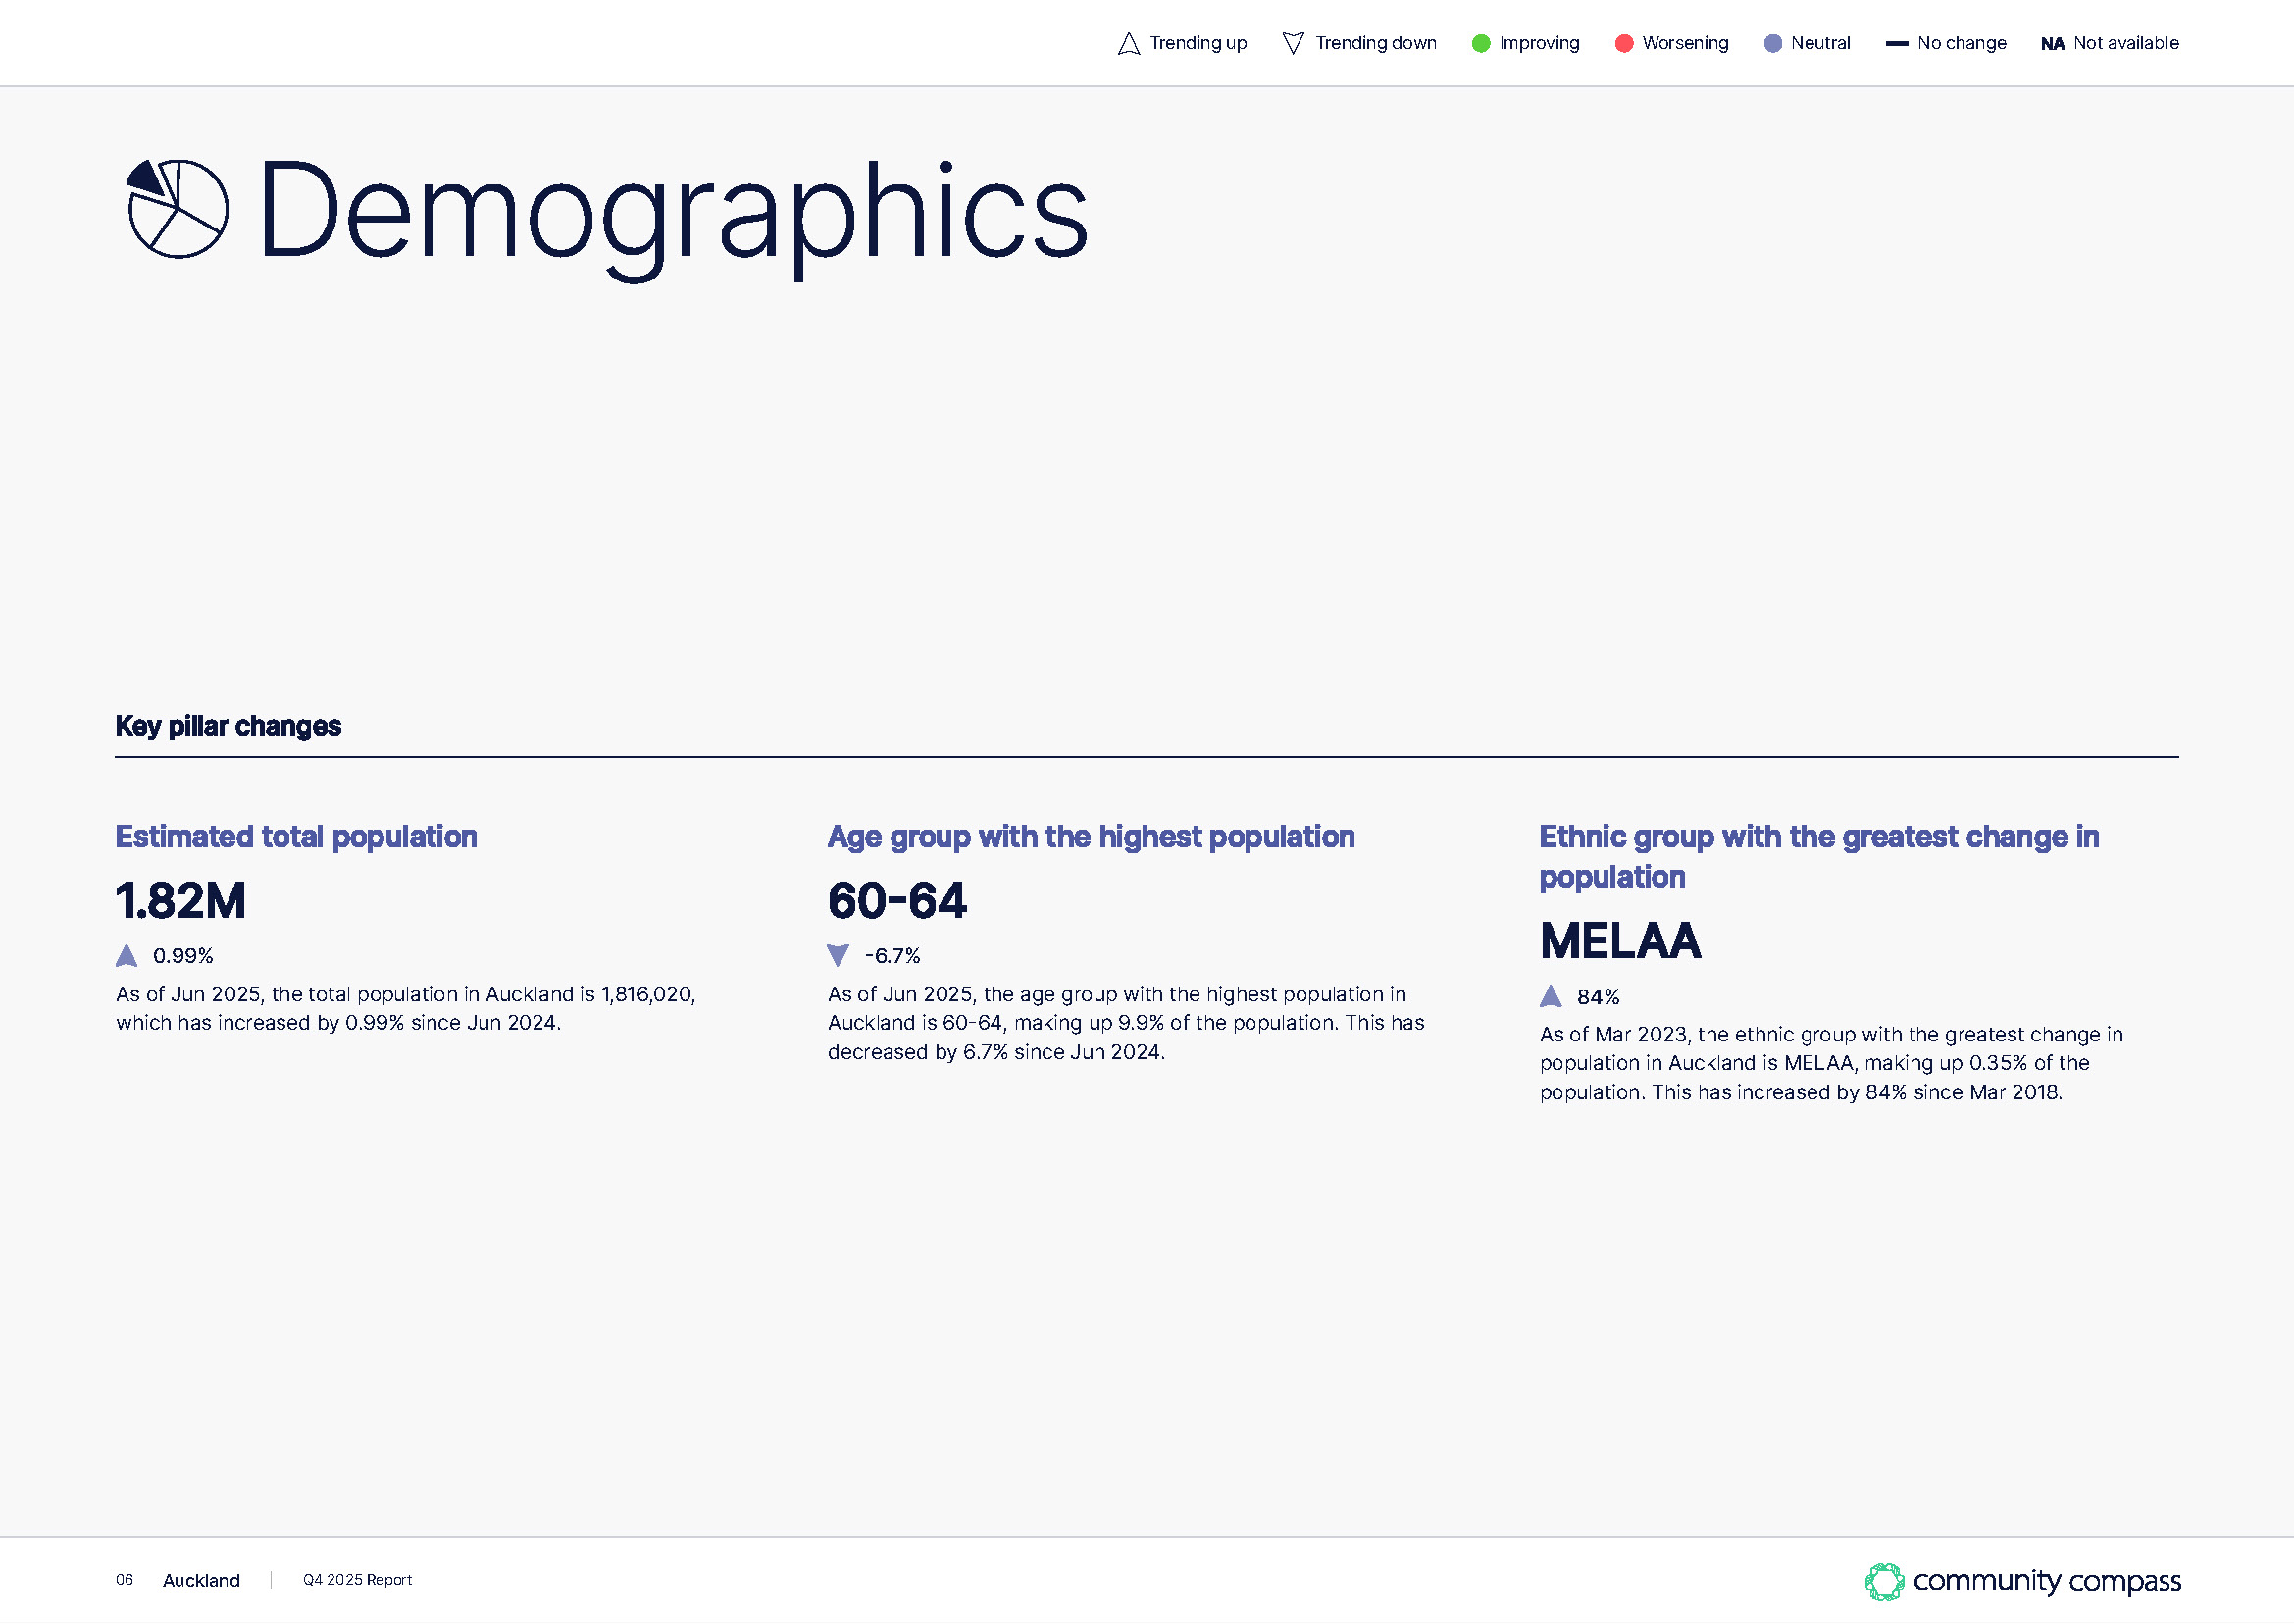
Stay informed with the Demographics pillar, offering up-to-date population counts and precise estimations, crucial for comprehensive analysis and strategic development planning. Tailor your plans to meet the specific needs of your residents, ensuring optimal community development.

Community Compass Deprivation
Deprivation

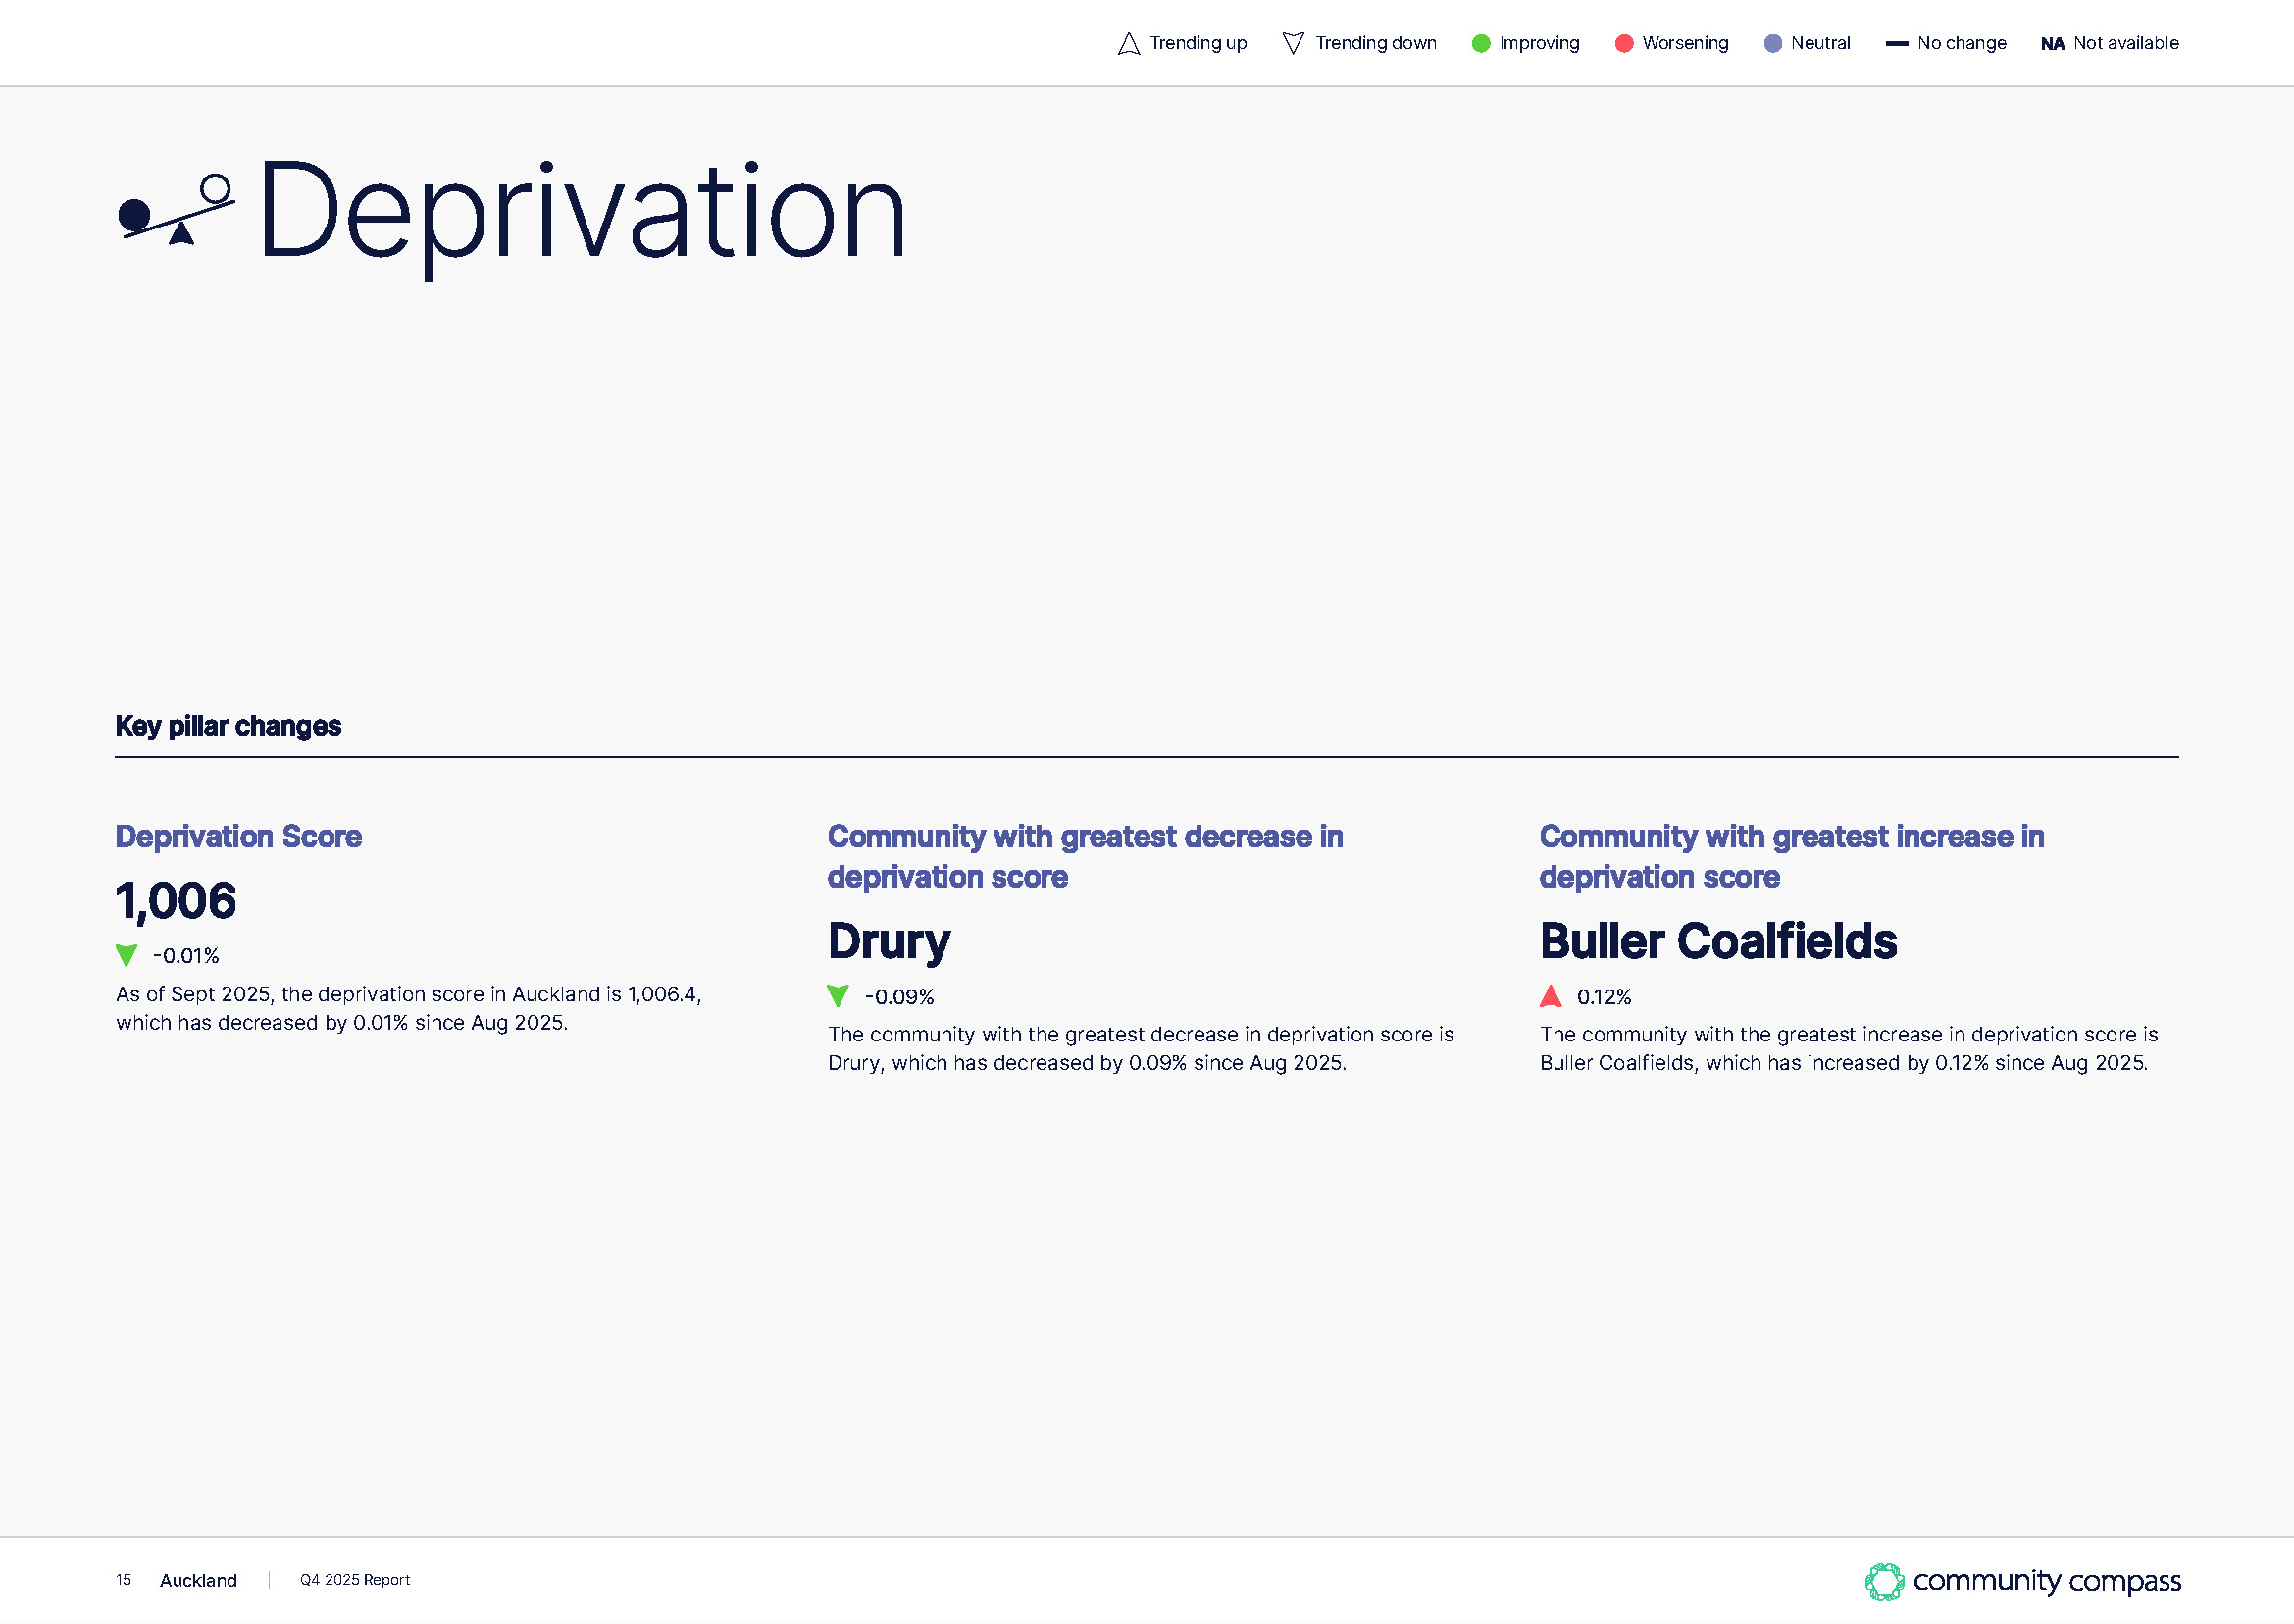
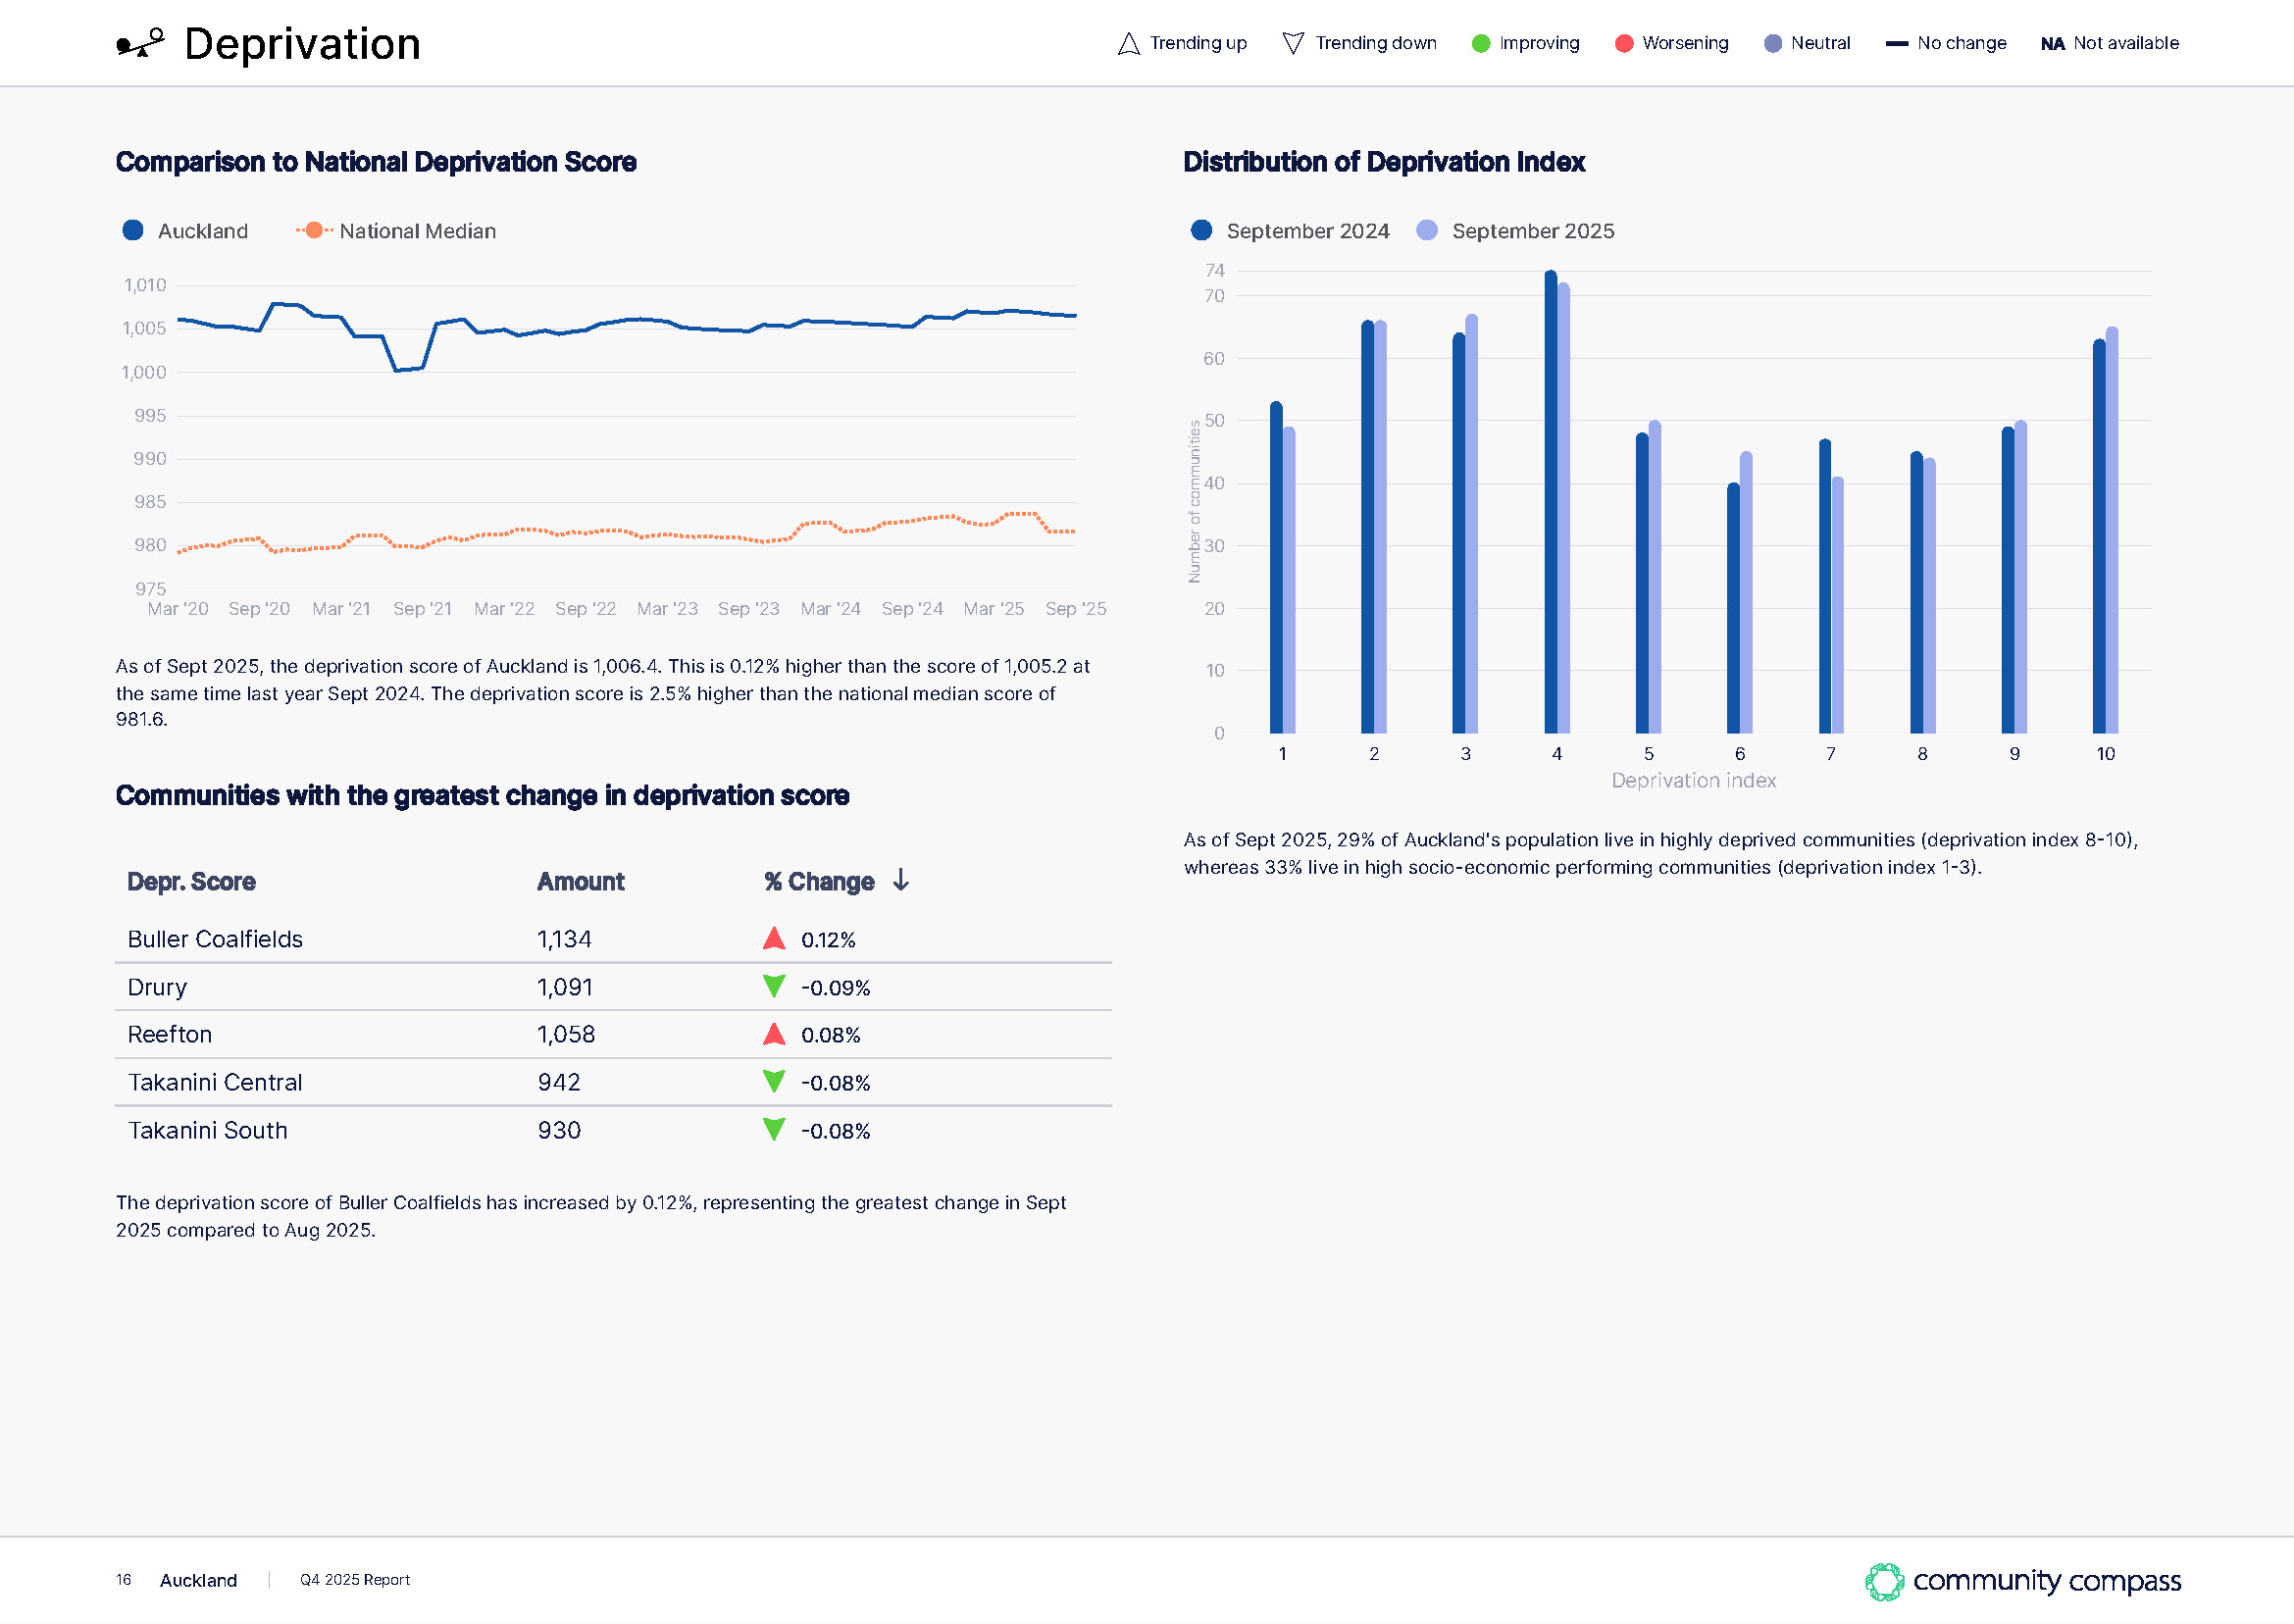
Leverage the Deprivation pillar, enhanced by DOT’s Dynamic Deprivation Index (DDI), providing near real-time insights into socio-economic deprivation. Monitor the well-being of your communities, prioritise resource allocation, and foster equitable development and upliftment.

Community Compass Economy
Economy

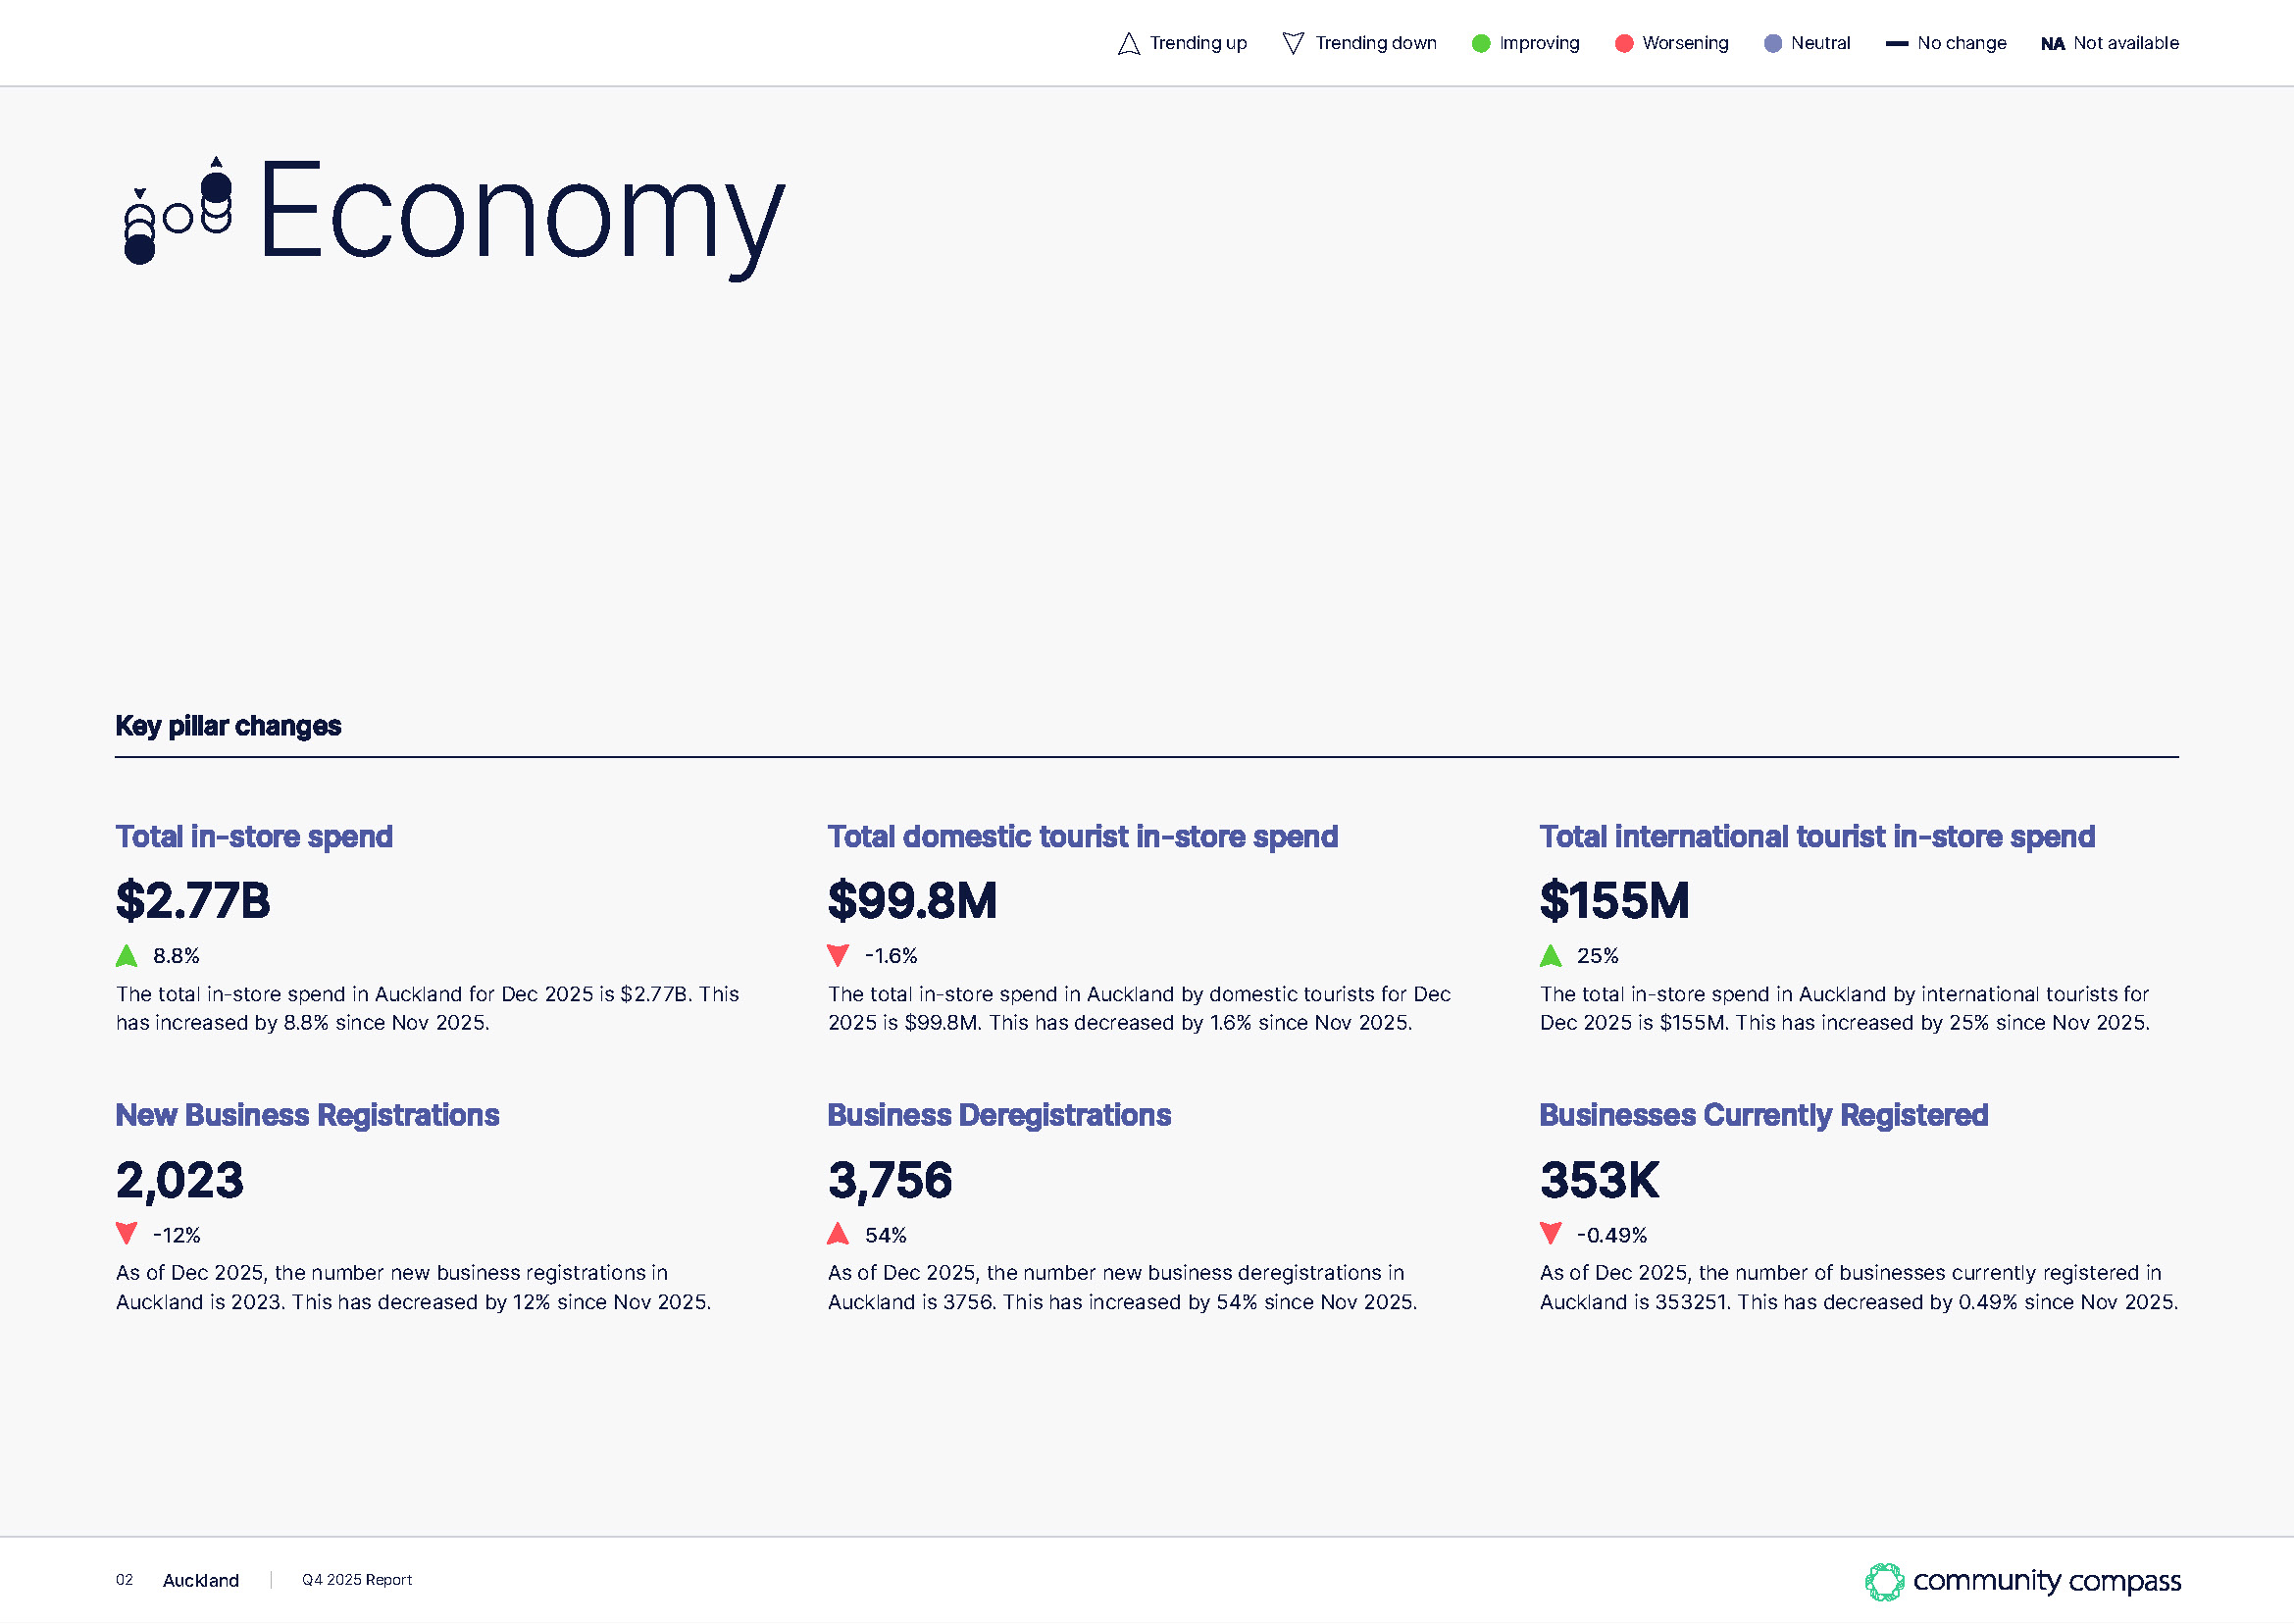
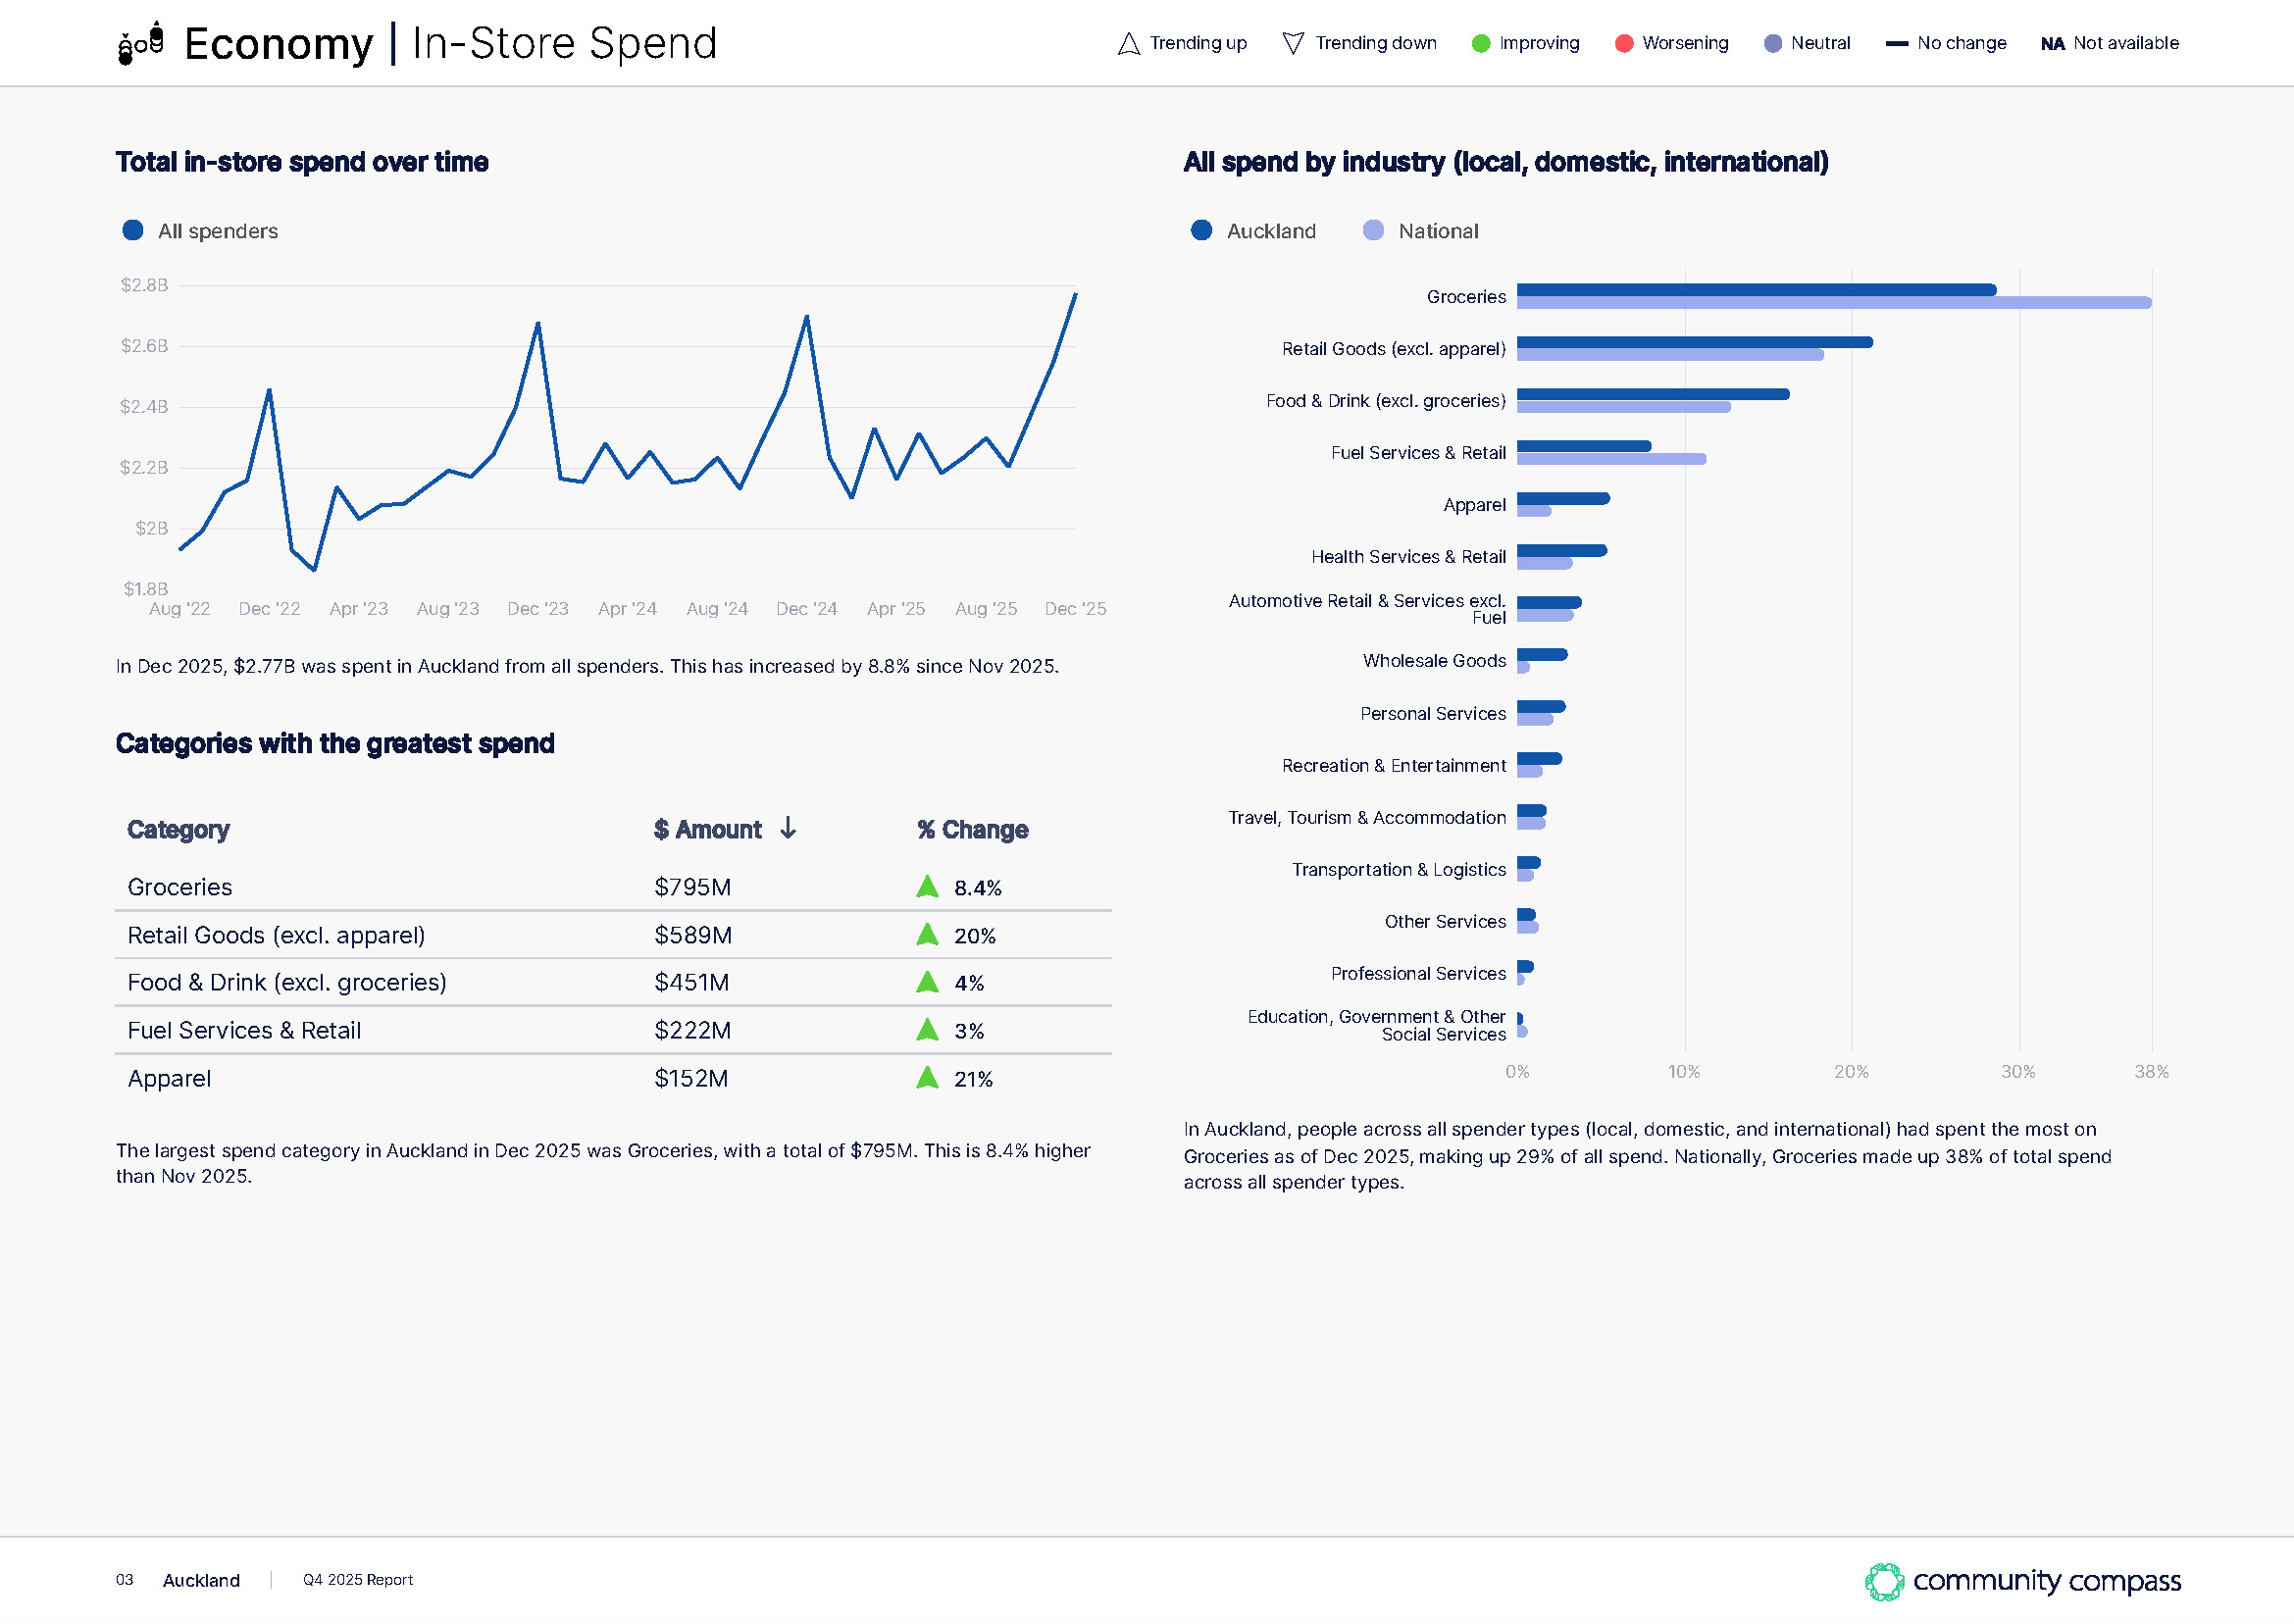
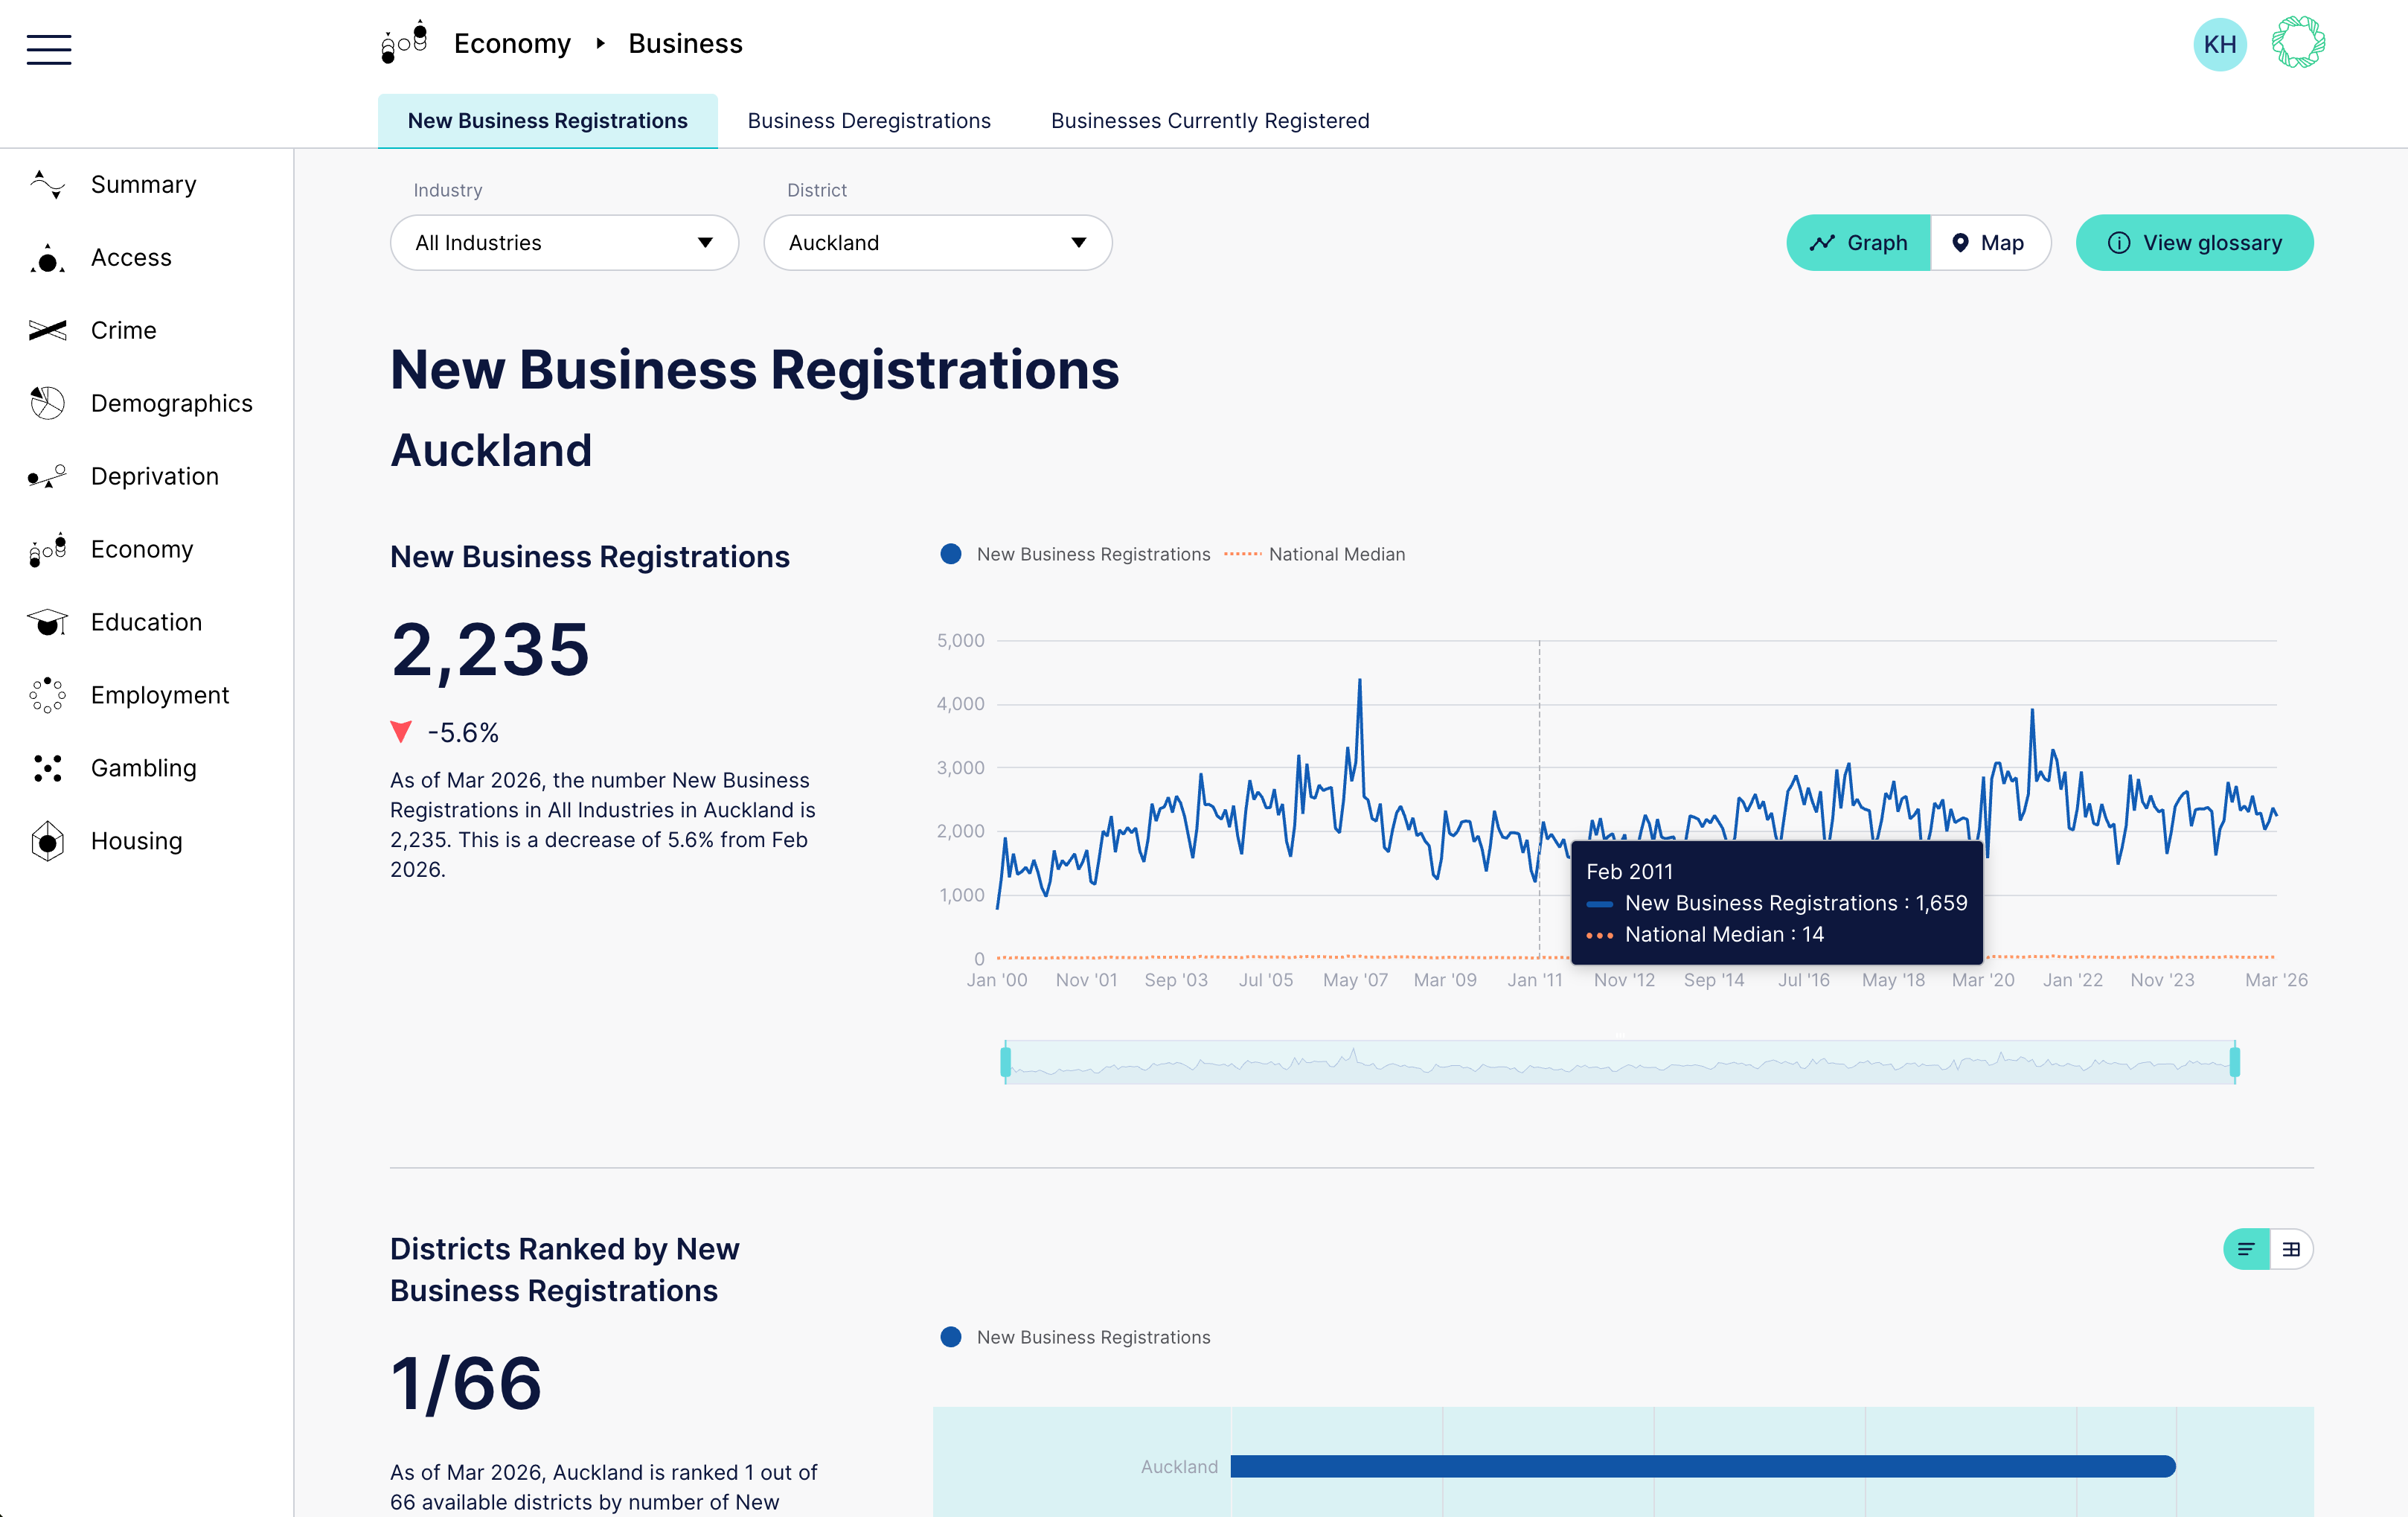
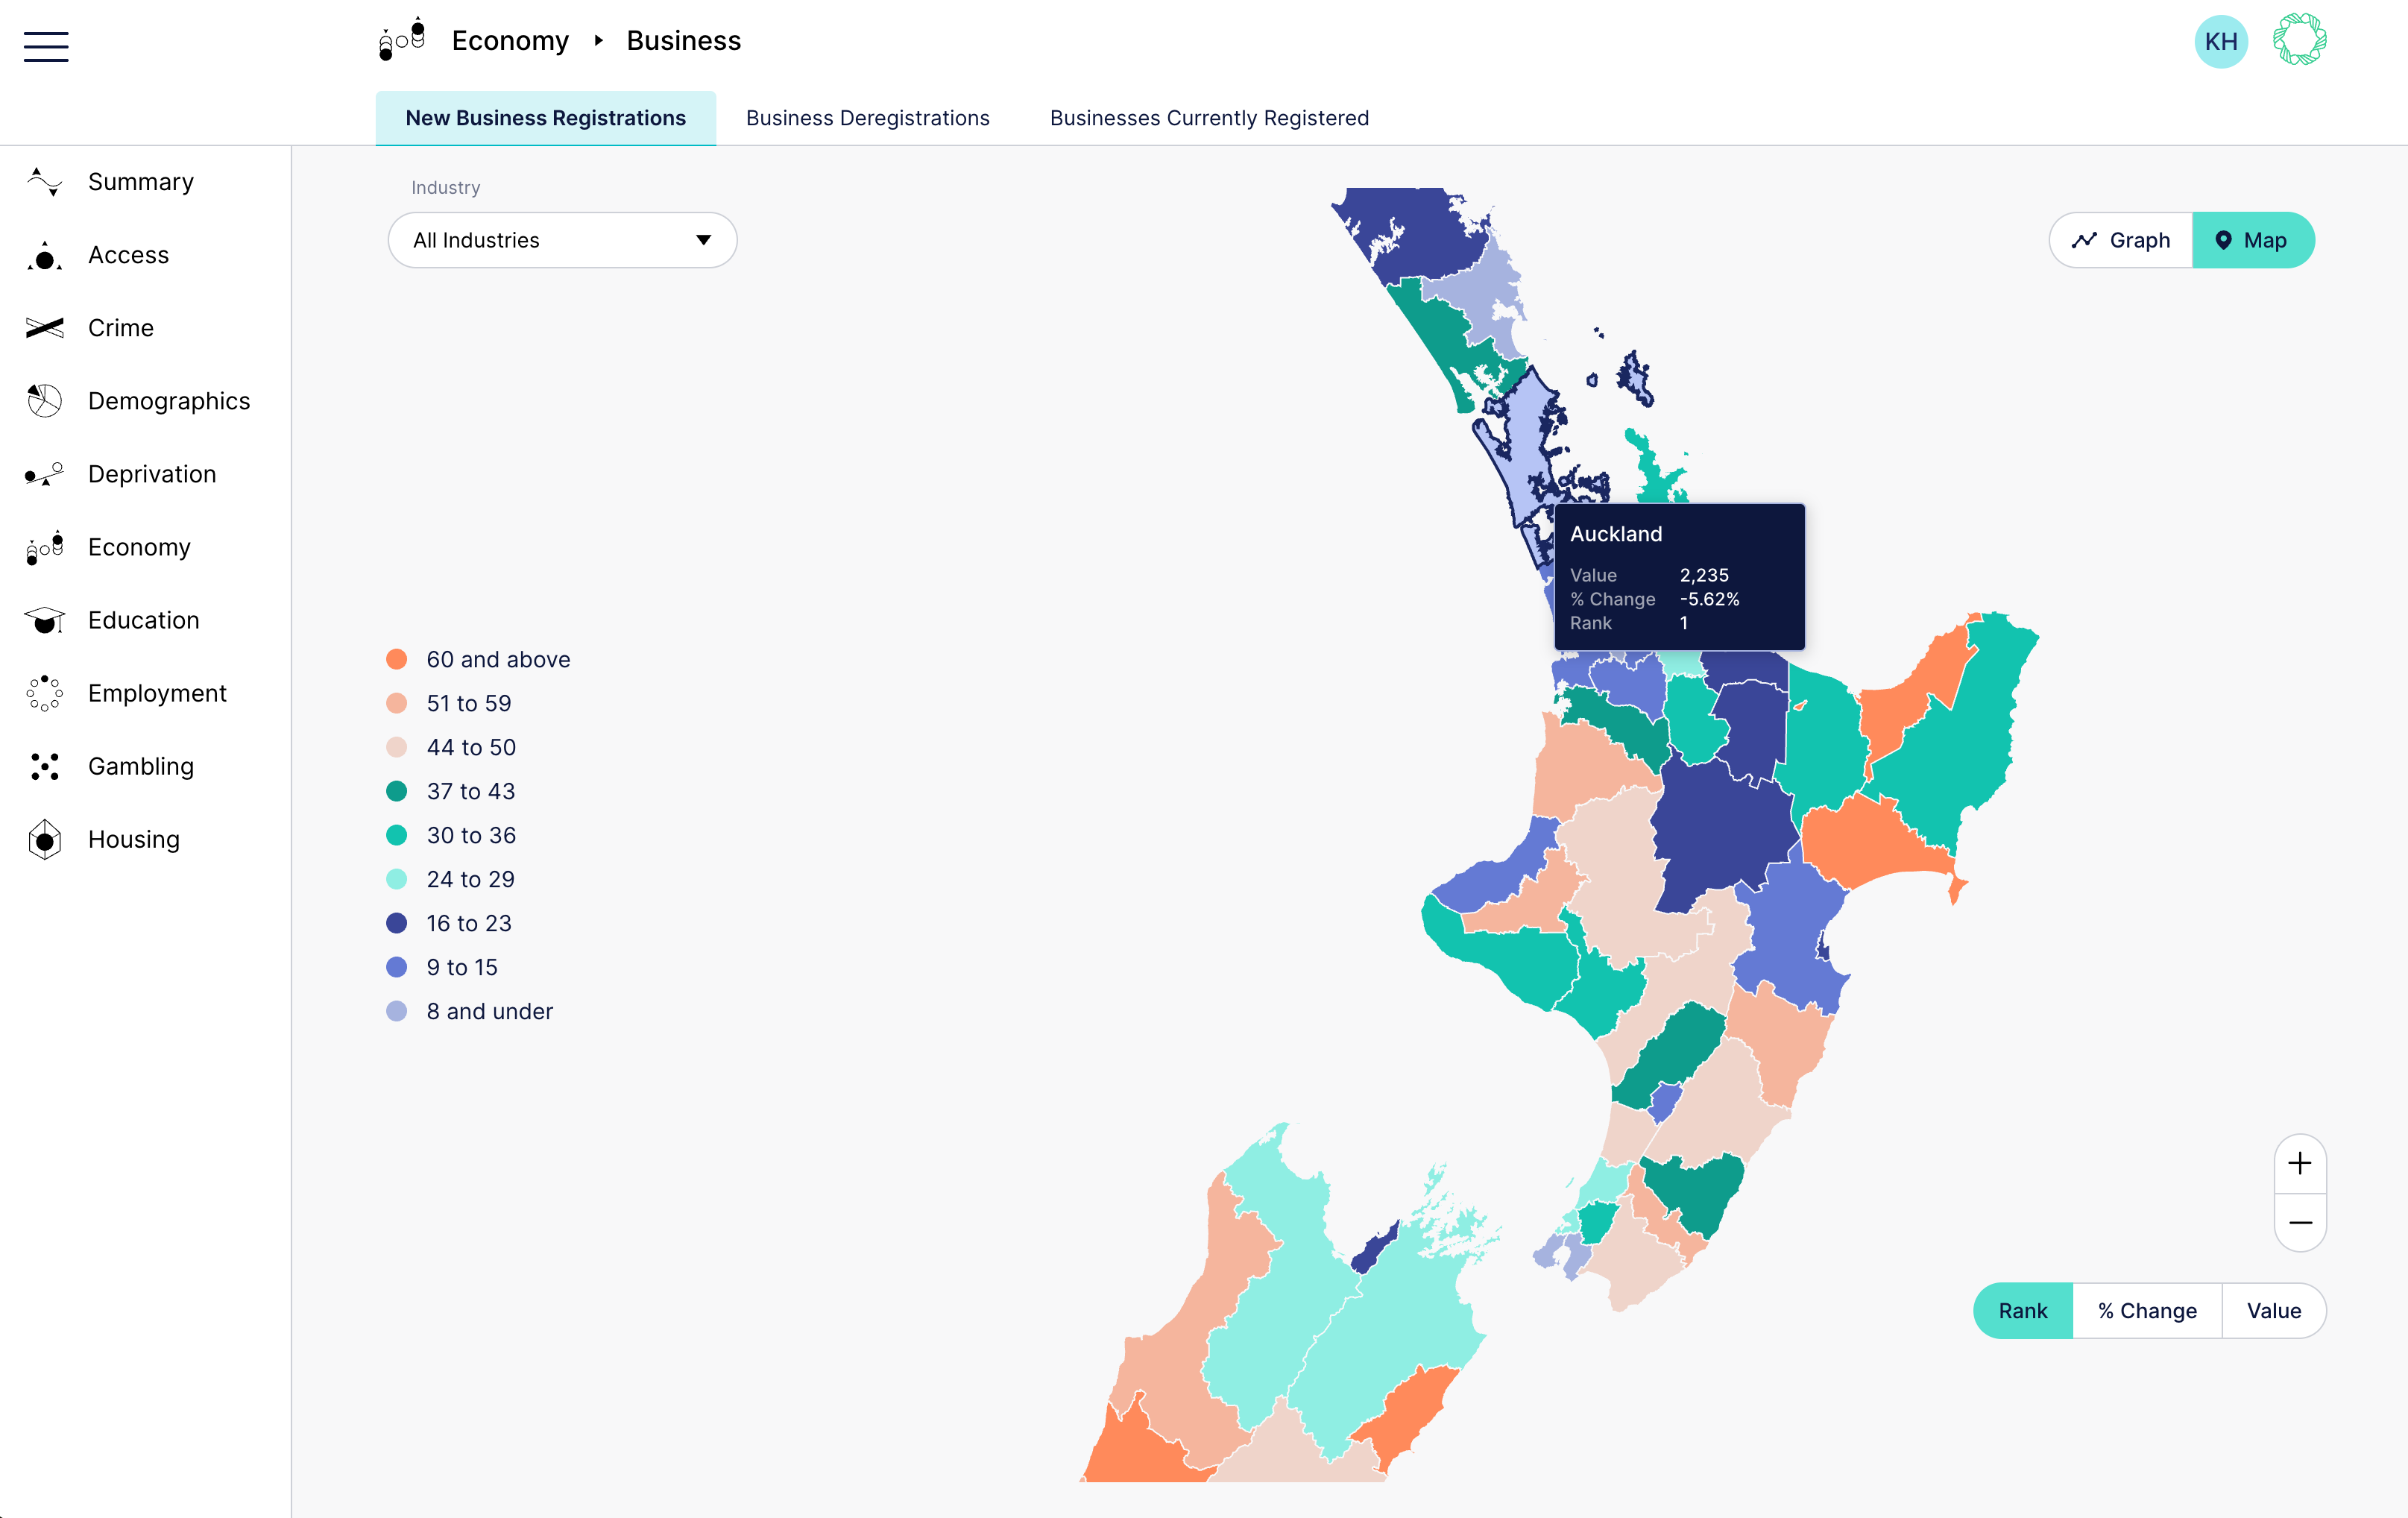
Explore economic trends with the Economy pillar, enriched with robust datasets from public and proprietary sources. Identify emerging trends, capitalise on opportunities, and foster a thriving business environment in your area.

Community Compass Education
Education

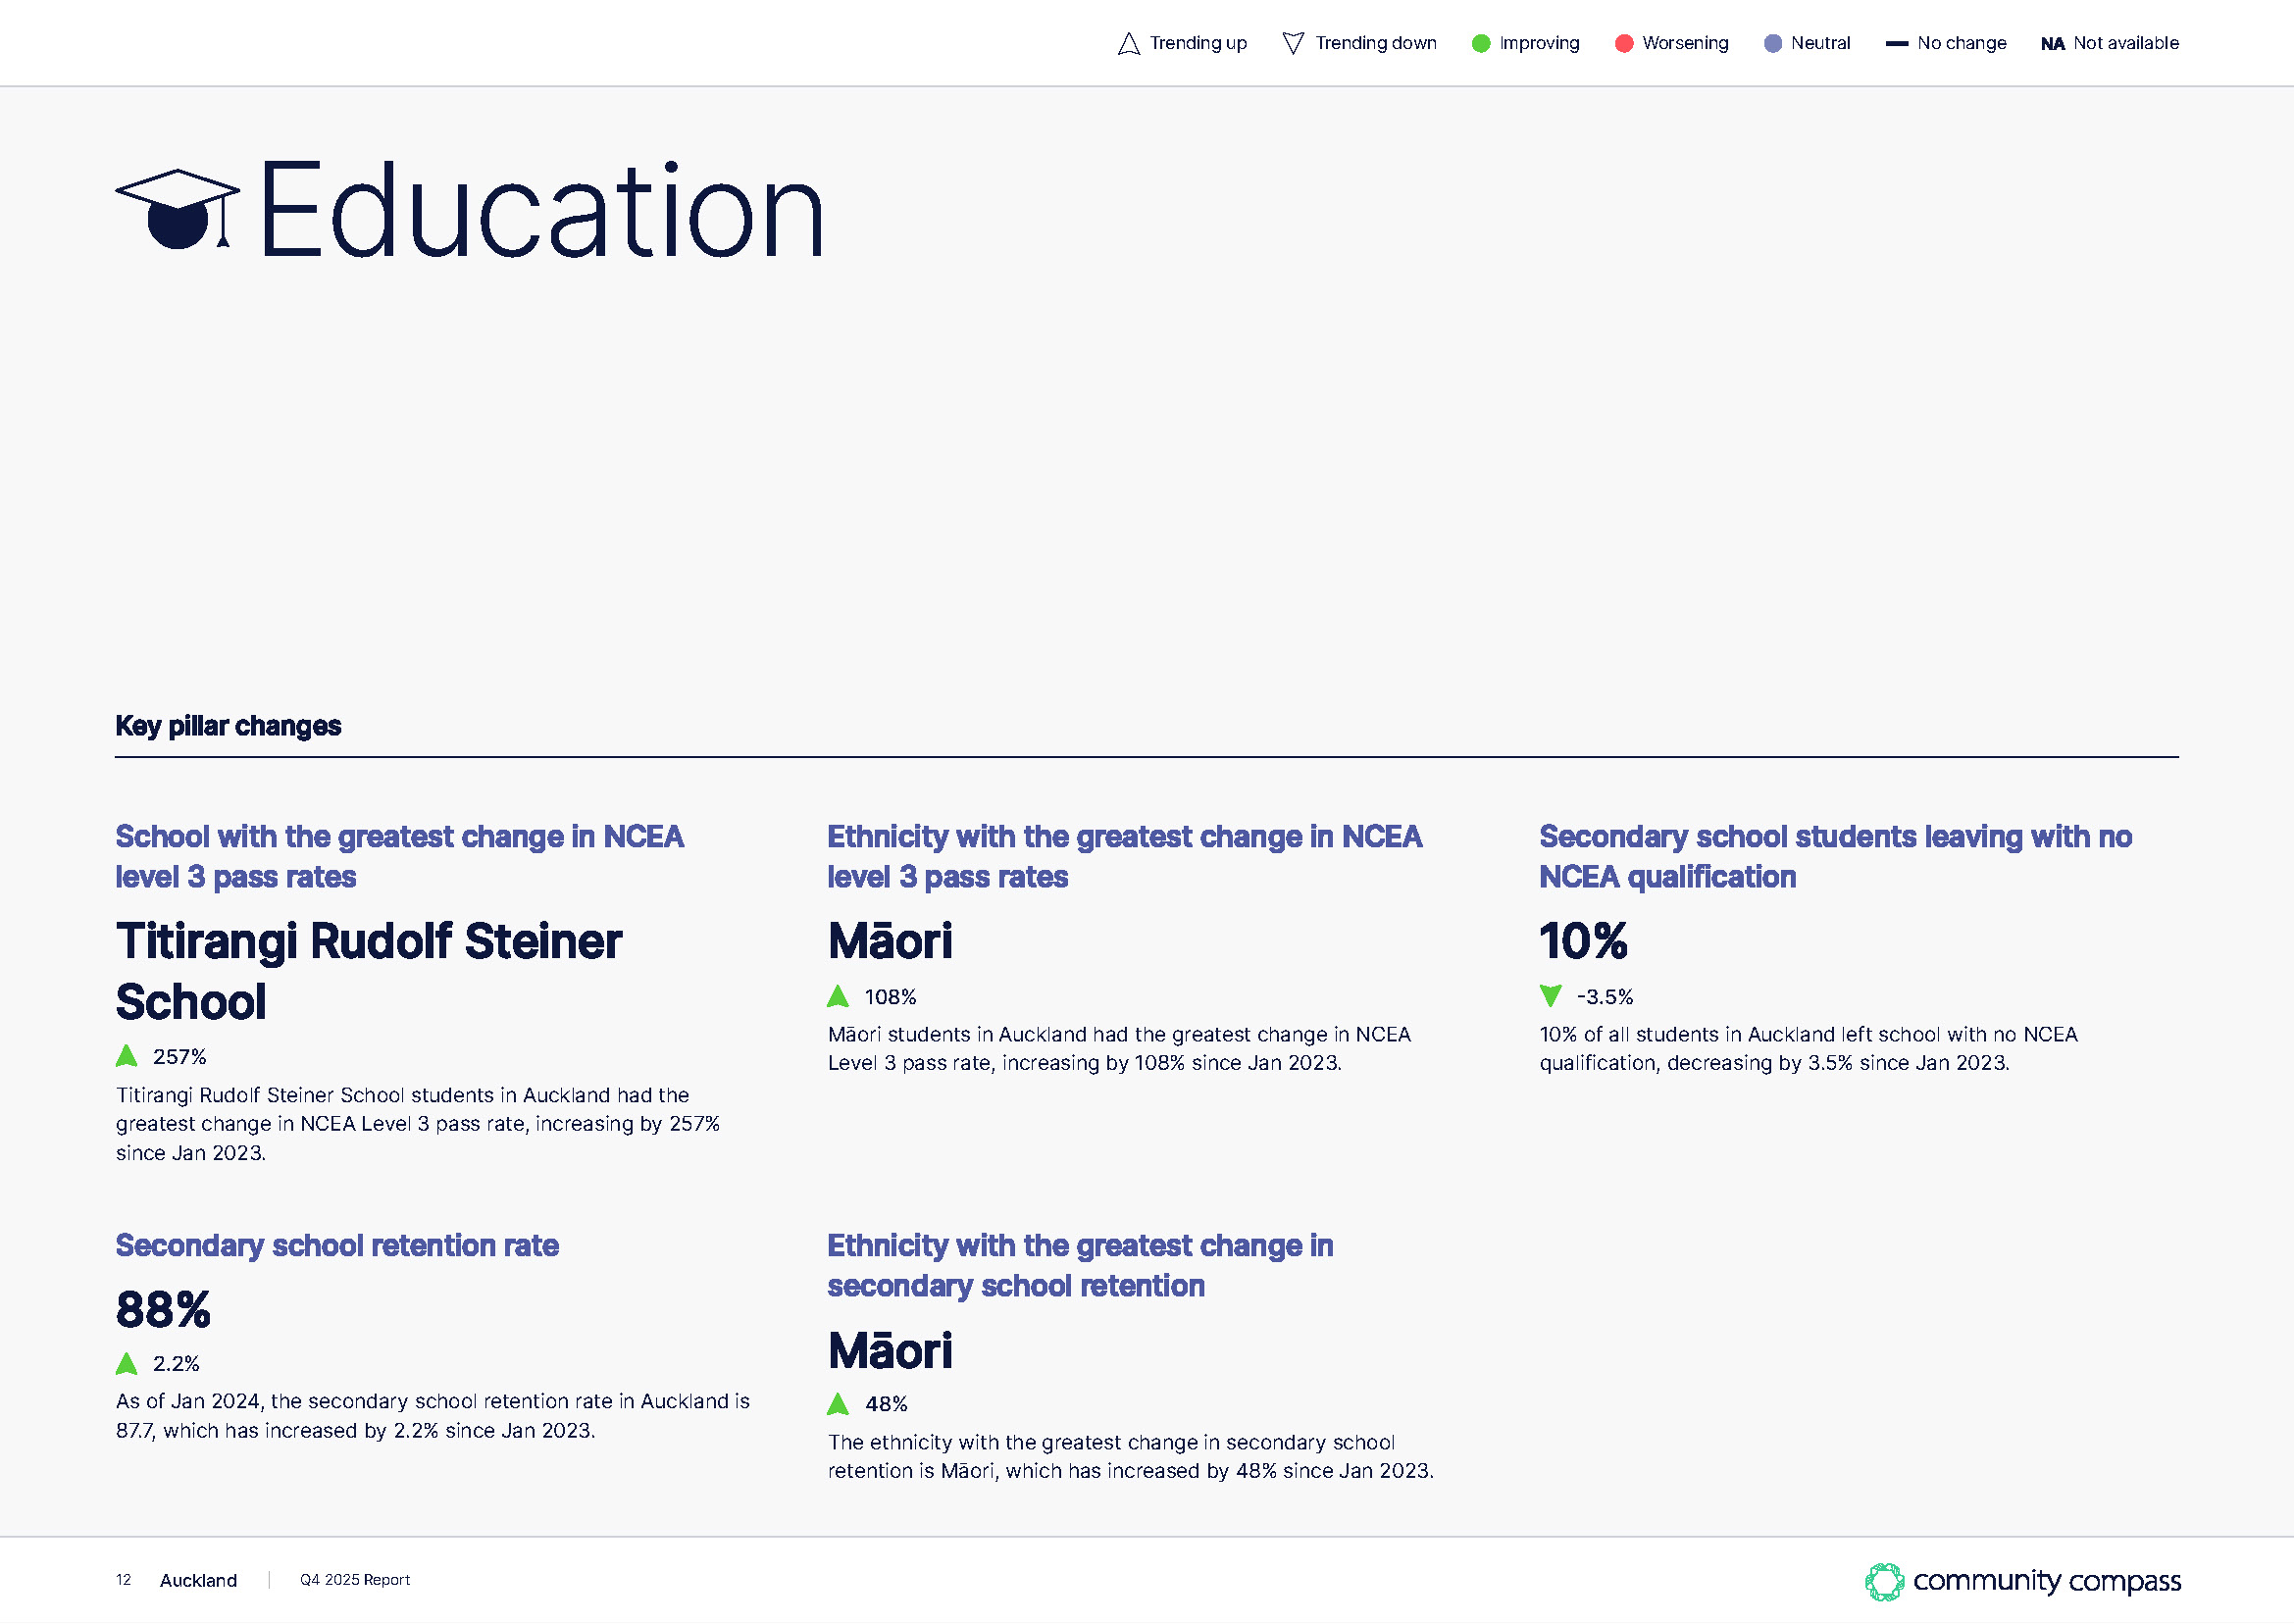
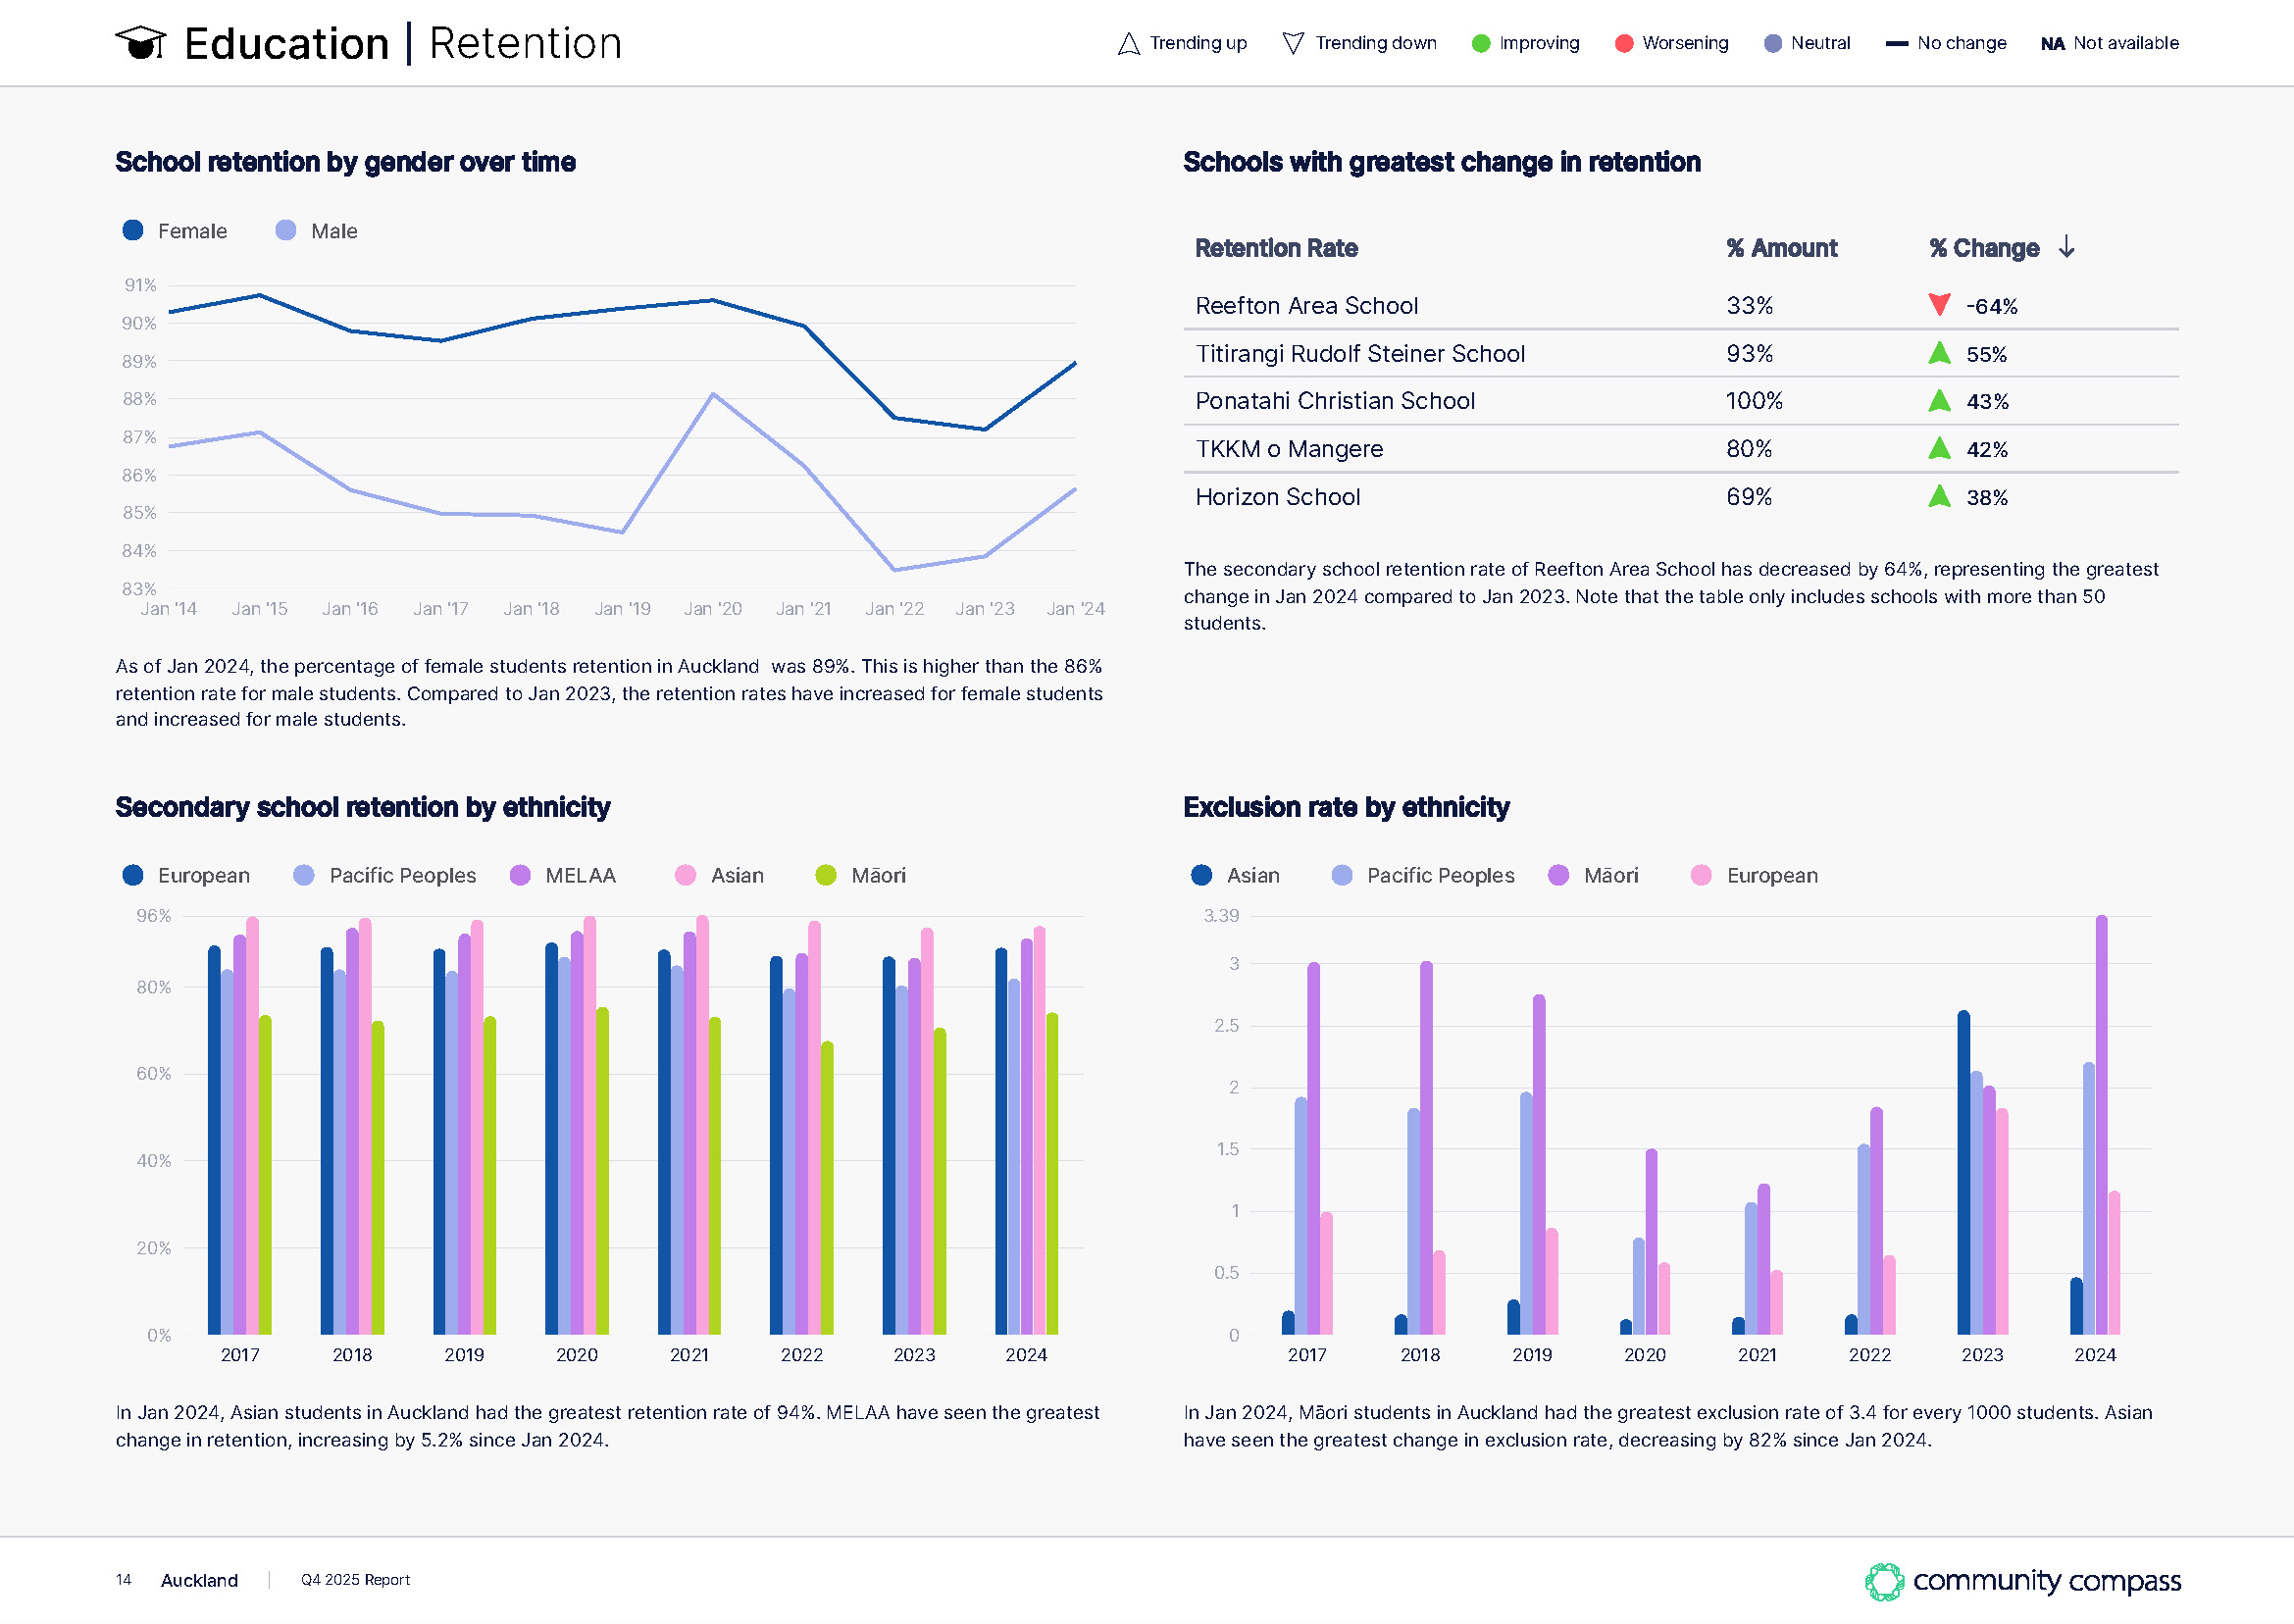
Enhance educational outcomes with the Education pillar, offering a comprehensive set of achievement based measures. Compare your region to the national average, identify areas for improvement, and implement targeted interventions for continuous enhancement.

Community Compass Employment
Employment

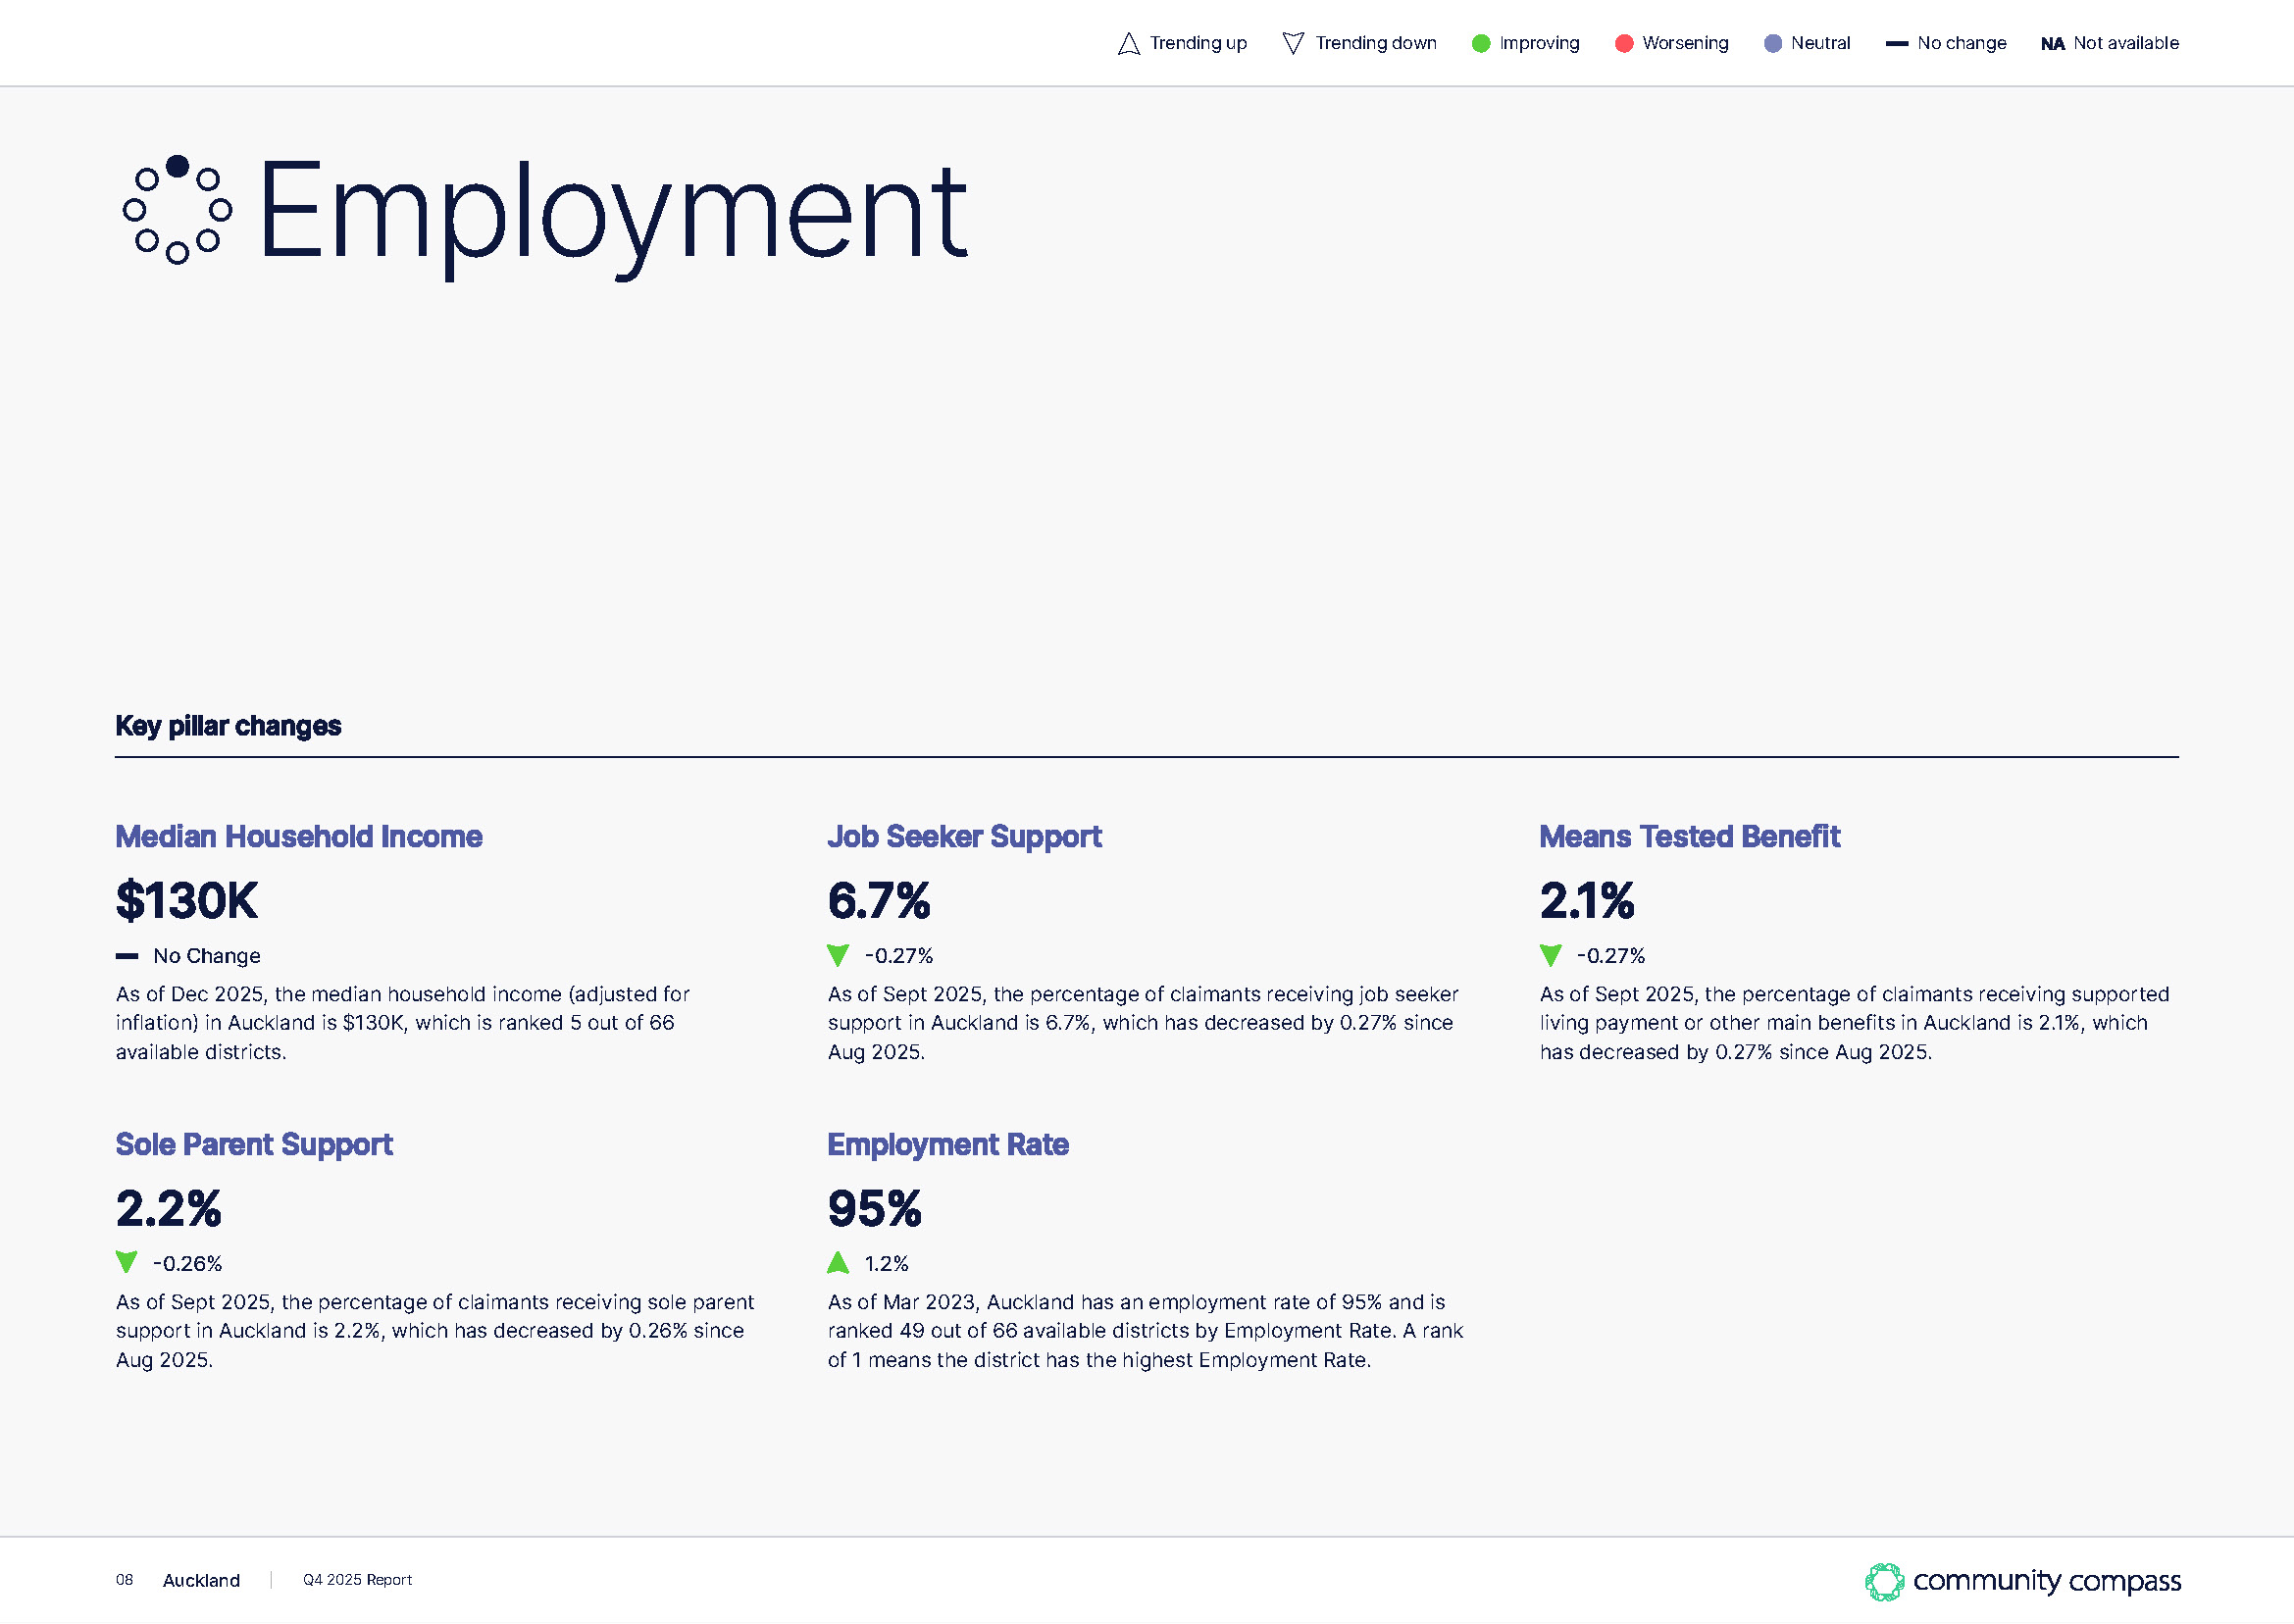
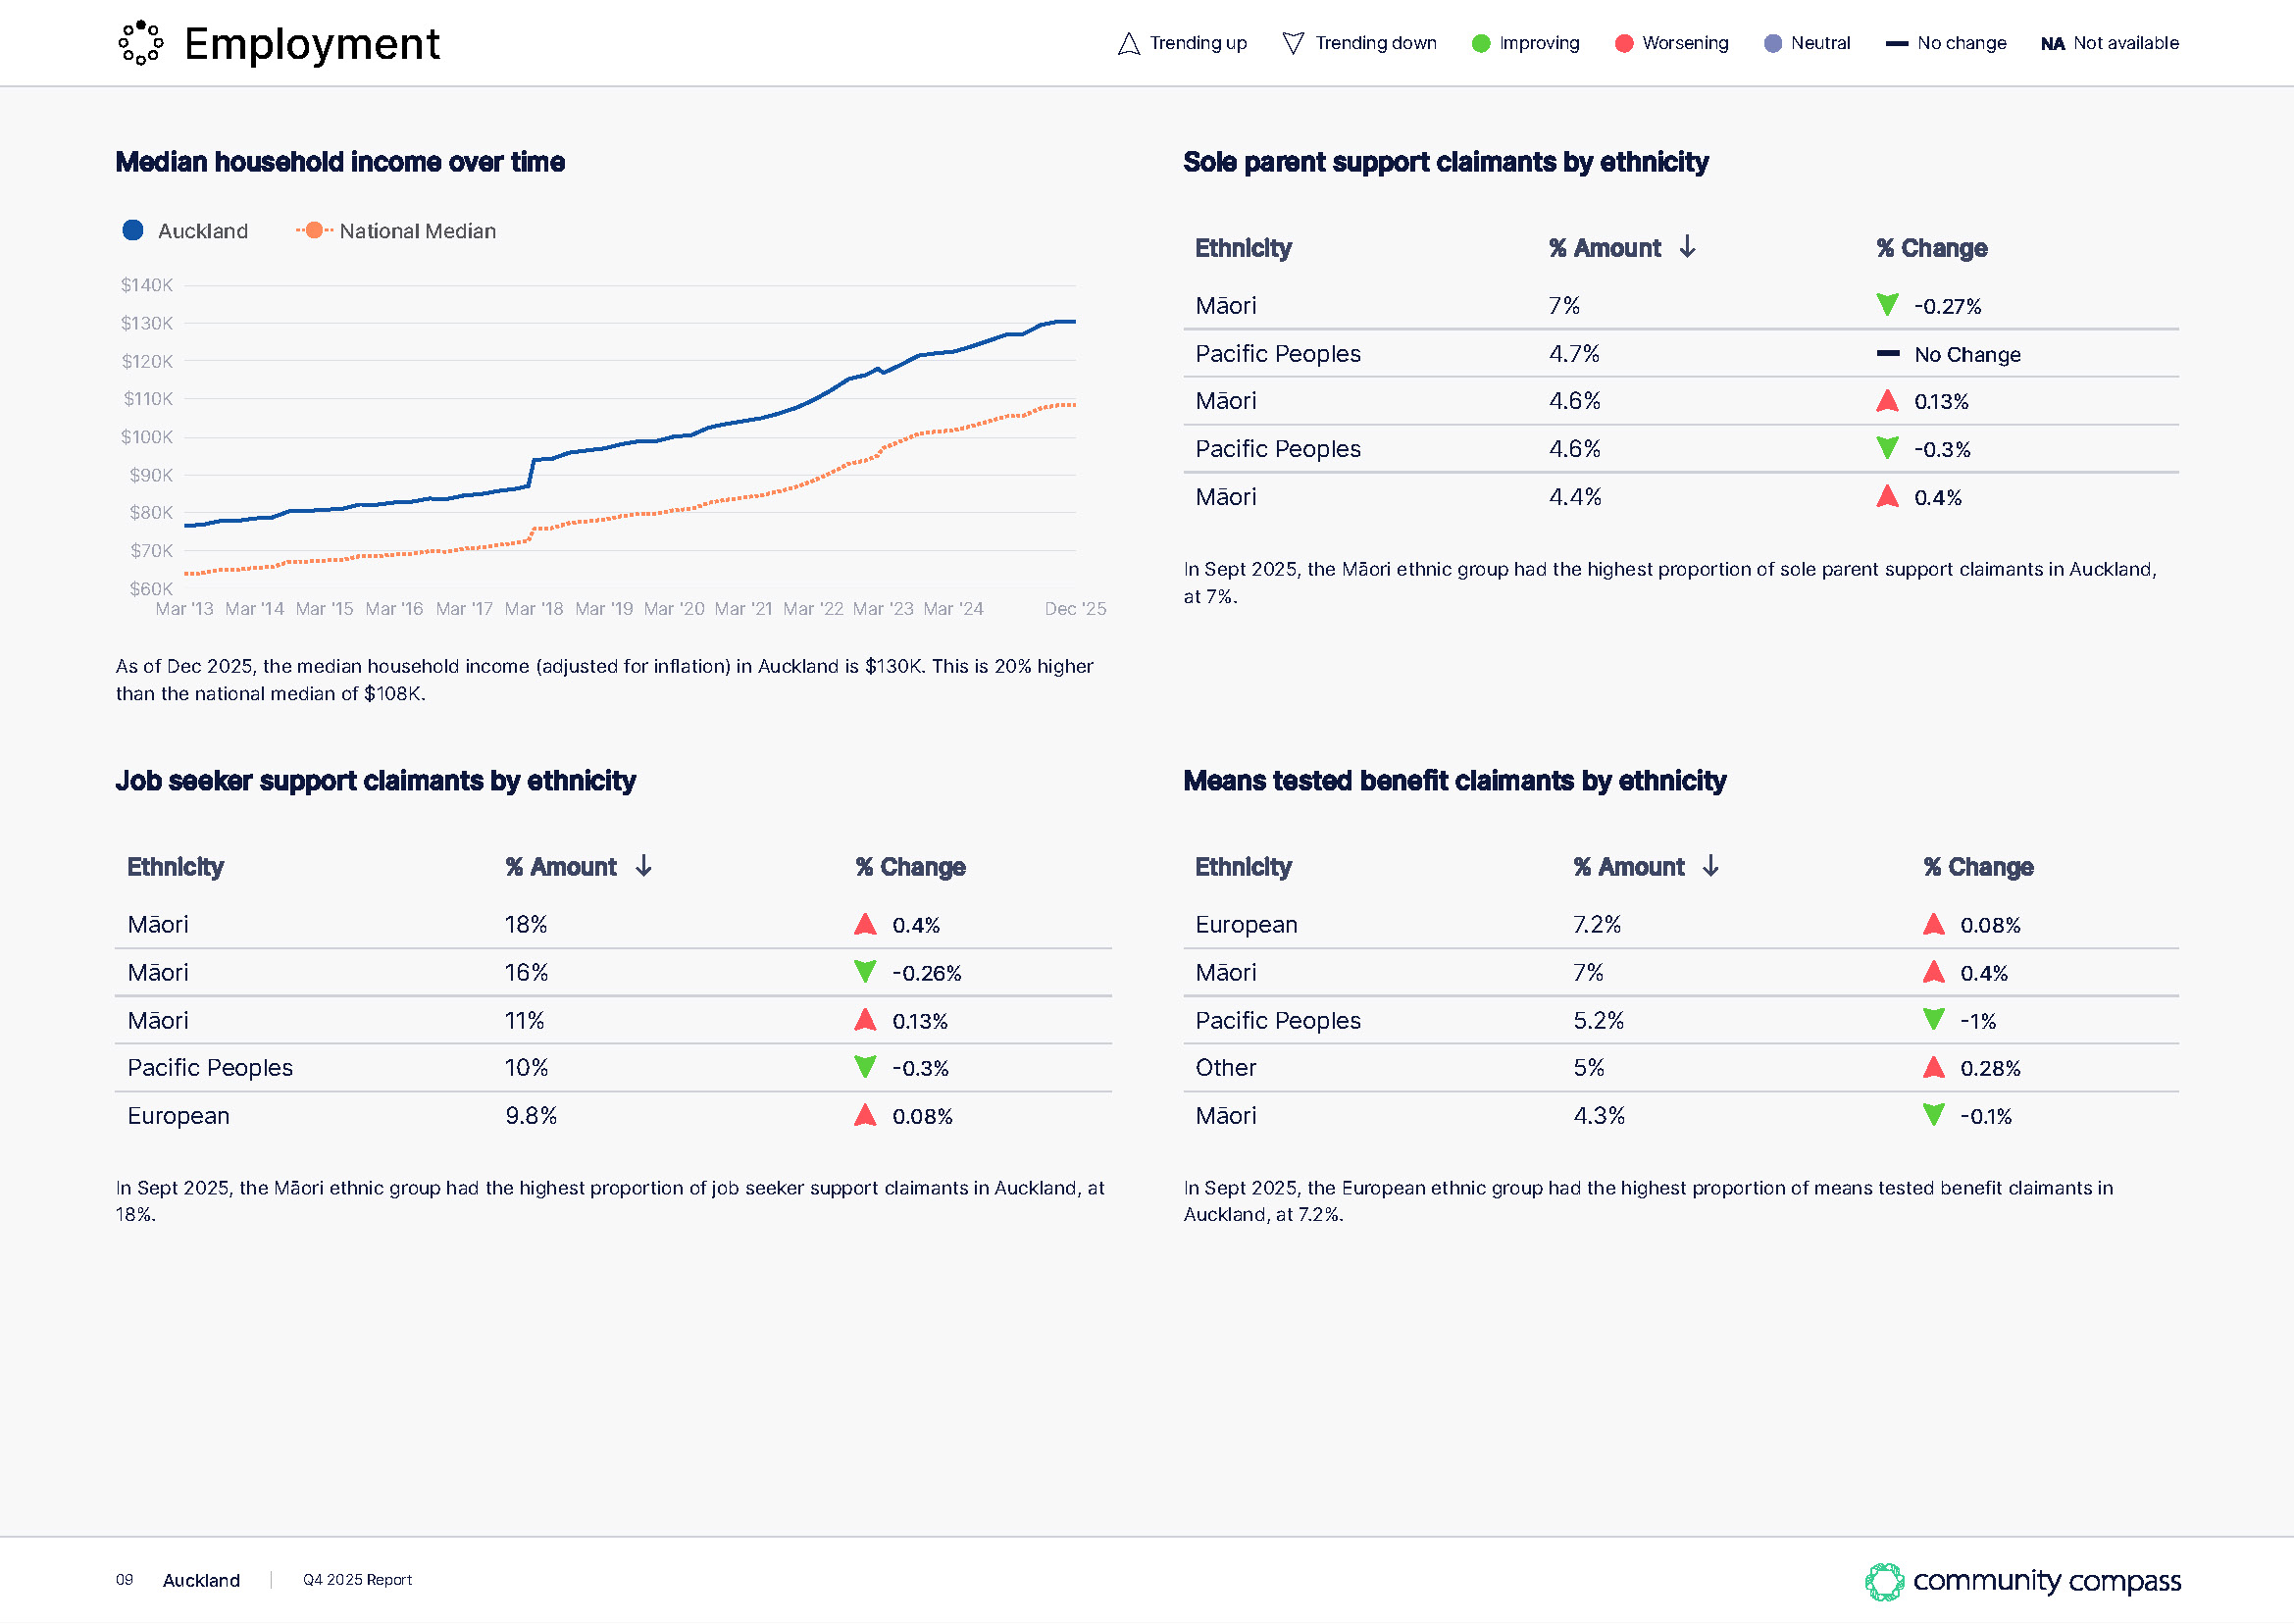
Navigate the dynamic New Zealand labour market with the Employment pillar, providing insights from up-to-date and historical data. Adapt strategies to ensure favourable conditions for employment opportunities in your area.

Community Compass Environment
Environment

Make informed decisions with the Environment pillar, offering dynamic information on safe swimming sites, air quality, electric vehicle adoption, and solar power usage. Contribute to a healthier and eco-friendly environment for your communities.

Community Compass Gambling
Gambling

Understand gambling trends with the Gambling pillar, offering comprehensive data for responsible gambling practices. Ensure the well-being of individuals and foster a safe and regulated gambling environment within your communities.

Community Compass Health
Health

Prioritise well-being with the Health pillar, providing key metrics to formulate effective strategies and policies. Implement targeted interventions for improved health outcomes within your communities.

Community Compass Housing
Housing

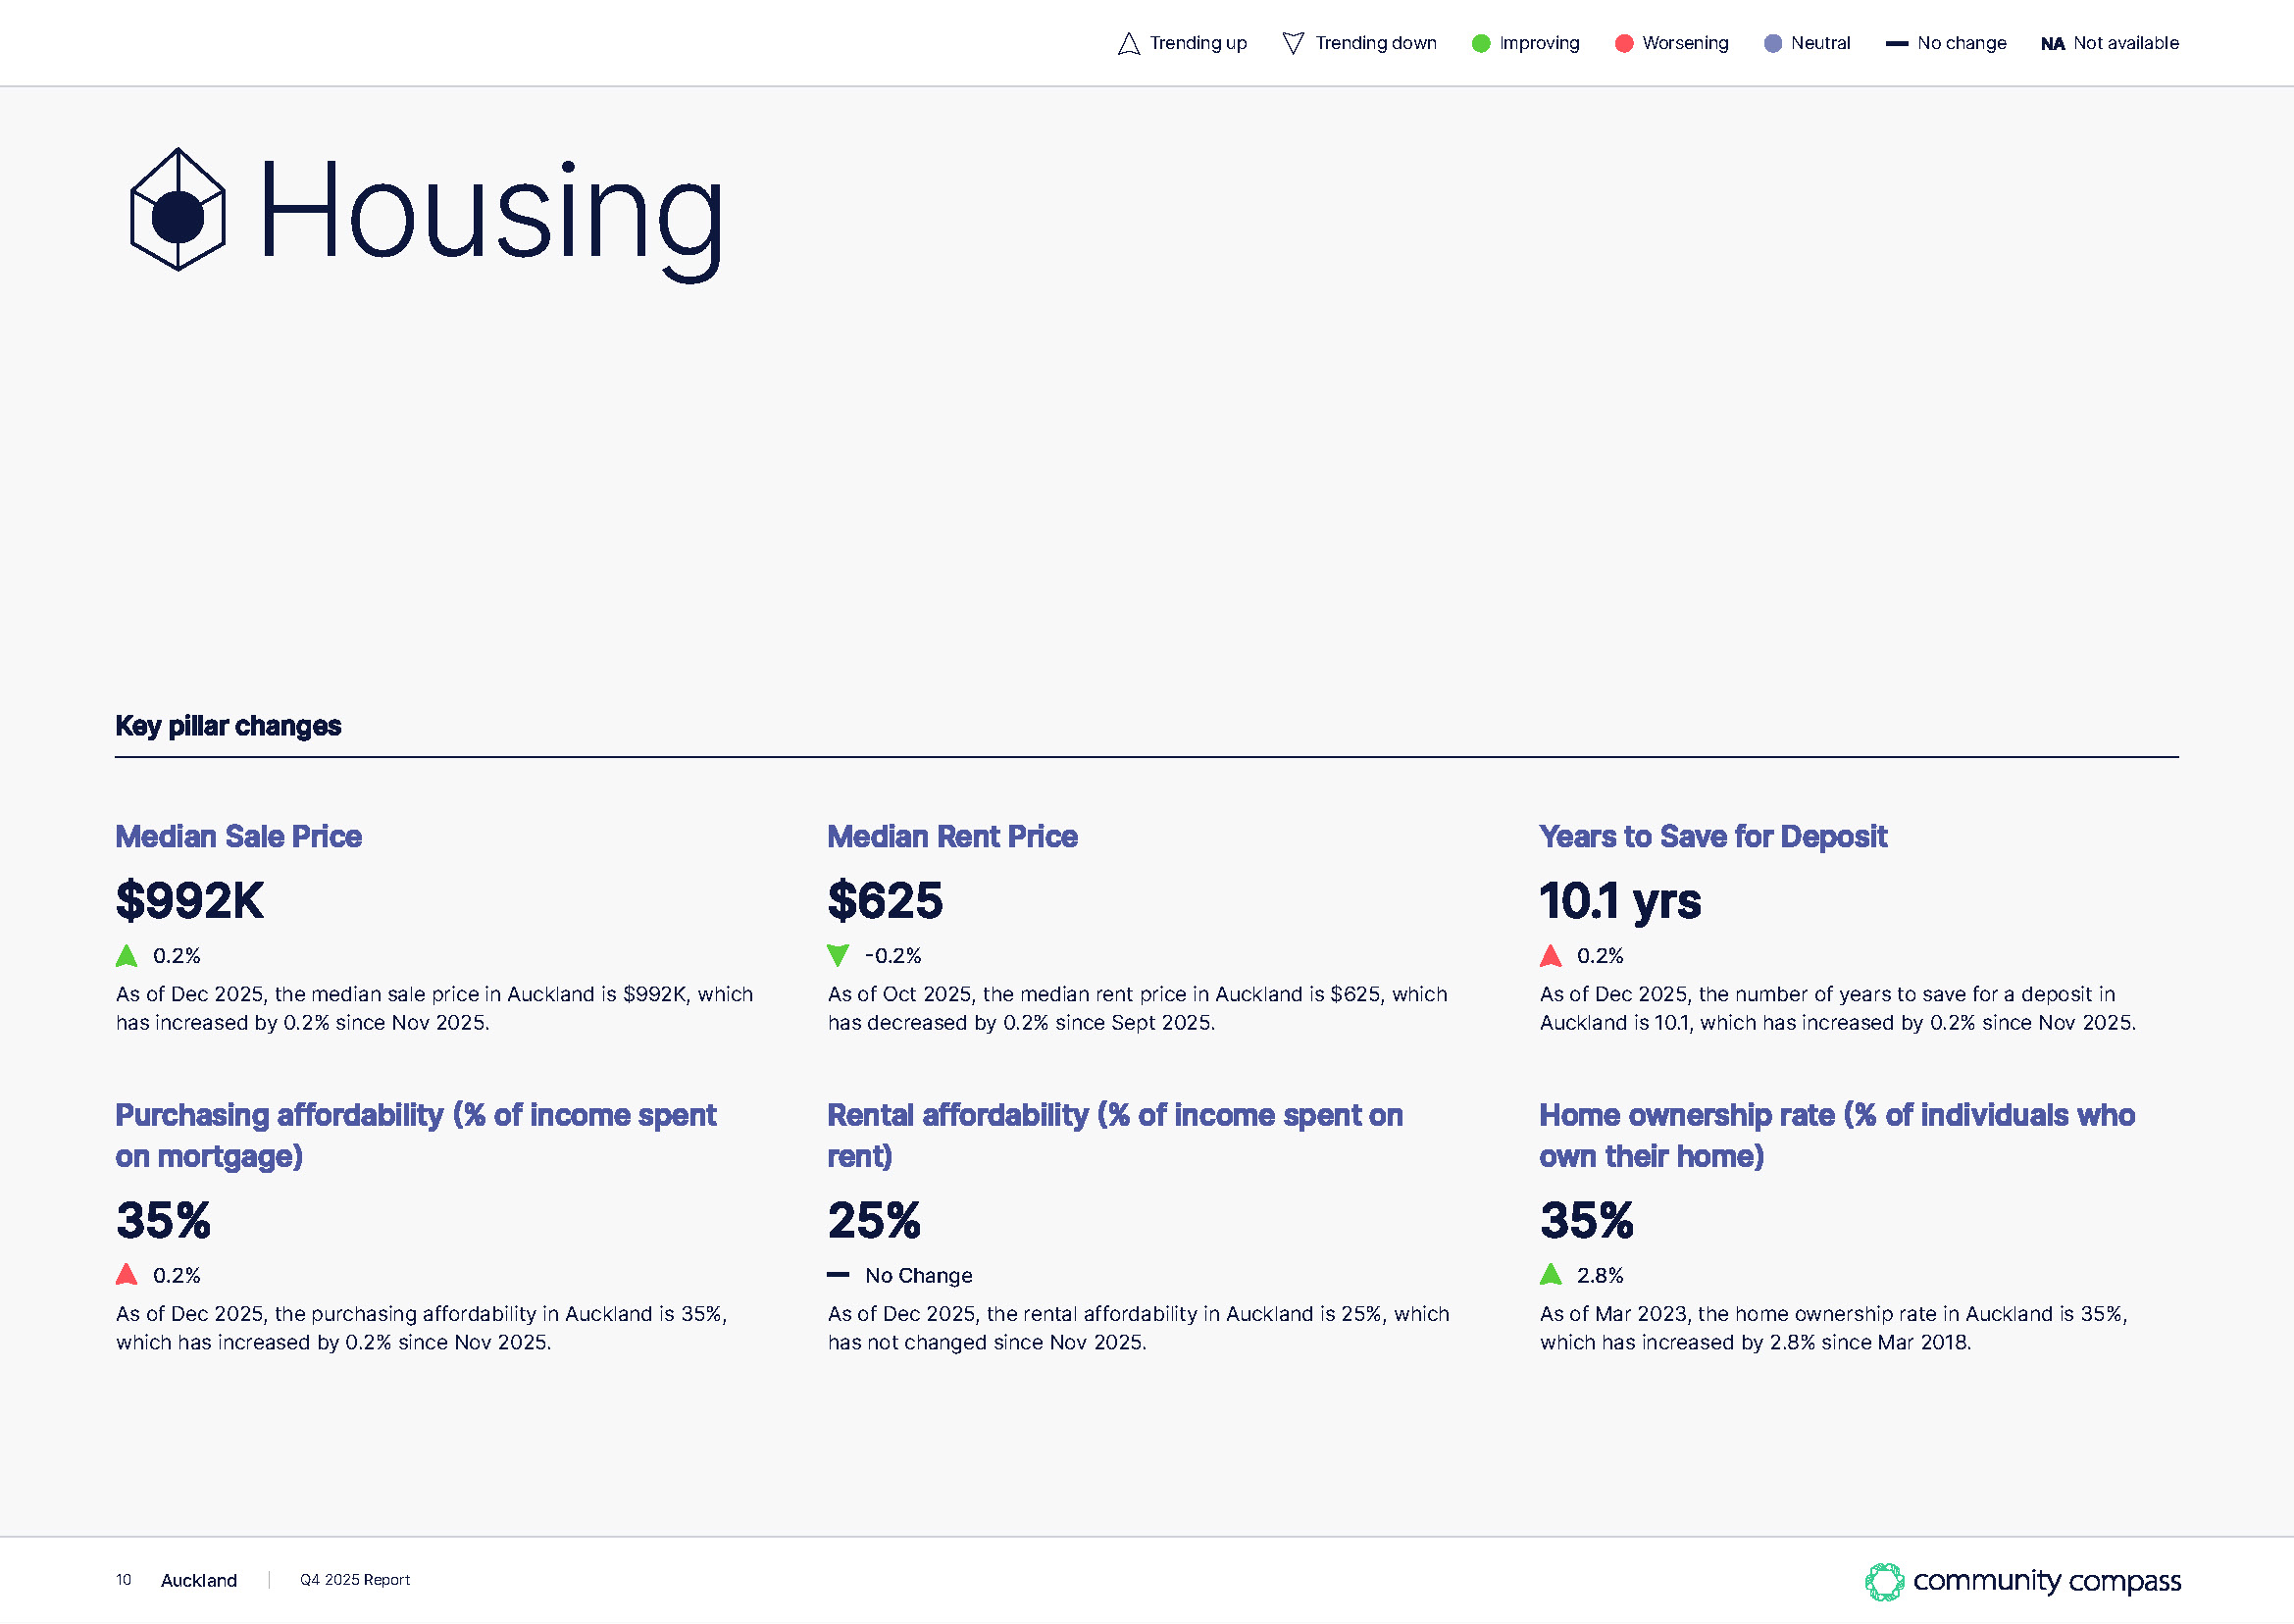
Address housing challenges with the Housing Pillar, offering insights into the dynamic New Zealand housing market. Access up-to-date and historical data on median house prices, affordability, healthy homes metrics, and more for effective policy implementation.

Track how a community compares against the national and regional average.

Community compass

Complex data, made simple

We take big, complex data sets and apply DOT’s principles of ‘Simple. Smart. Beautiful.’ to deliver you an intuitive and easy to navigate solution.

Community compass dashboardCommunity compass dashboardCommunity compass dashboard

Use cases

Here are a few examples of how Community Compass has helped our clients solve their challenges.

How can we prioritise which communities to support when our health sector finance is limited?

  • Identify deprived communities with limited access to health services.
  • Target initiatives to communities with low quality of housing, low income and low educational attainment.
Health
Deprivation
Access
Housing
Employment
Education

How can we make public spaces safer during a crime spike?

  • Identify locations with unusually high crime rates.
  • Target those locations with additional CCTV or police presence.
Crime

How can we better understand our customers?

  • Identify what type of customers are more likely to churn or engage with certain content.
  • Acquire customers who are more likely to be loyal. Data driven messaging to promote content to the right customers at the right time.
Deprivation

Doing the work for you

Community insight reports are issued quarterly, providing further analysis on your region.

Community compass quarterly report
“I’ll recommend Community Compass to others as it saves a lot of time and has all of our data in one place.”
Don Cameron
Former Mayor of Ruapehu District Council
“Community Compass has proven to be an indispensable resource enabling us to better understand our communities and tailor Council initiatives to local needs.”
Mike Nuth
Principal Advisor Research And Evaluation, Hutt City Council
“Hat's off to DOT Loves Data for a great product and customer service.”
Rachel Dossor
Wairoa District

Want to find out more?

Get in touch